DevOps, SRE and platform engineering - how software reaches production
DevOps is a way of working that shortens the path from a code commit to a working change in production, and sends what production sees back to the people who wrote the code. This lesson explains what that means in practice, how the DevOps engineer, SRE and platform engineer roles differ, how the four DORA metrics measure delivery, what the 12-factor rules ask of an app, and how one change travels from a pull request to production and, if needed, back.
Why it matters
The first ten minutes of most DevOps, SRE and platform interviews are about this lesson. "What is DevOps to you", "what is the difference between DevOps and SRE", "how would you measure whether a team delivers well", "walk me through what happens after a developer merges" are standard openers at product companies and at Indian IT services firms alike. A weak answer is a list of tools. A strong answer describes a flow, names the metrics, and explains the trade-off between moving fast and staying up. Every later lesson in this roadmap is one piece of that flow, so this is also the map you will use to study the rest.
Lesson
What DevOps is, and what it is not
Before DevOps, most companies had two groups. Developers wrote code and handed it over, often as a zip file and a document, once every few months. Operations ran the servers. Developers were measured on features shipped, operations on uptime, so developers wanted change, operations wanted none, and every release was a fight.
DevOps is the decision to measure both groups on the same thing: how quickly and how safely a change reaches users. The way to get there is to shorten the path from commit to production and to make that path automatic, repeatable and observable. Three ideas carry most of the weight.
- Shared ownership. The team that writes a service also deploys it and is paged when it breaks. "You build it, you run it."
- Automation of the path. Build, test, package, deploy and rollback are scripts and pipelines, not people following a runbook by hand at 2 am.
- Fast feedback. Metrics, logs and traces from production go back to the people who made the change, within minutes, not in a monthly report.
Two things DevOps is not. It is not a team: a company that creates a "DevOps team" to sit between developers and operations has added a third silo. It is not a tool: buying GitHub Actions, Terraform and Kubernetes changes nothing if developers still file a ticket to get a server. Tools make the practices cheaper; they do not create them.
This roadmap deliberately drops tools that nobody hires for in 2026. You will see Nagios, Puppet, Chef and Docker Swarm named exactly once, here, so you recognise them in an old job description, and never again.
The delivery pipeline and the feedback loop
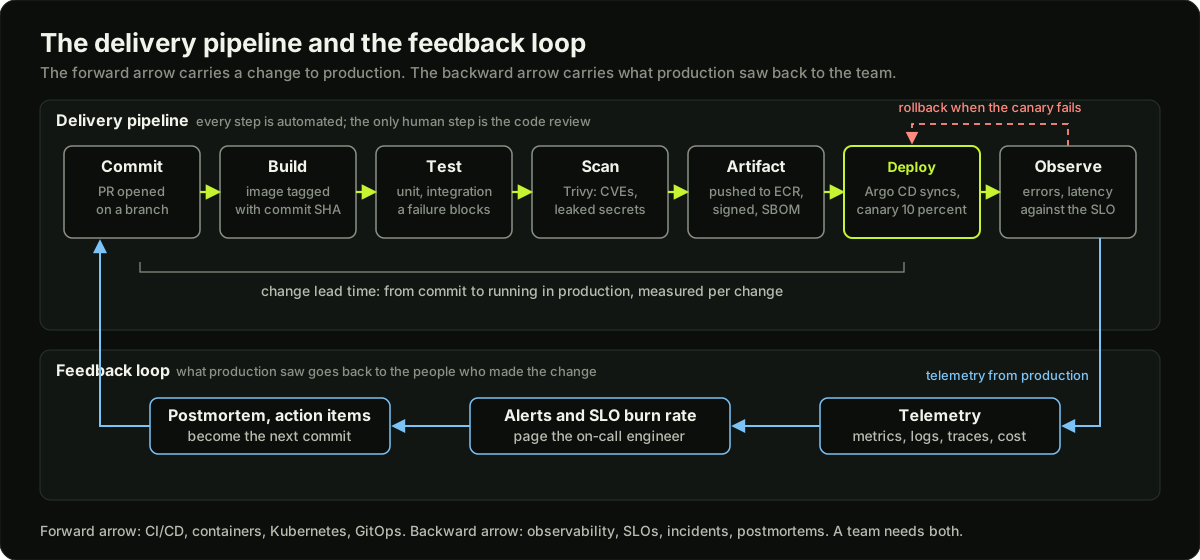 A change moving left to right from commit through build, test, scan, artifact, deploy and observe, with a telemetry arrow looping back from production to the team
Think of two arrows. The forward arrow is the delivery pipeline: a commit is built, tested, scanned, packaged into an artifact (a container image), deployed, and watched. The backward arrow is the feedback loop: telemetry from production (request rates, errors, latency, logs, traces, cost) comes back to the team and becomes the next commit, the next alert threshold, or the next rollback.
CI/CD, containers, Kubernetes and GitOps are the forward arrow. Observability, SLOs, incidents and postmortems are the backward arrow. A company with only the forward arrow ships fast and breaks blind. A company with only the backward arrow knows exactly why it is slow.
The three roles
The job titles overlap and every company draws the lines differently, but the centre of gravity of each role is clear.
Three SRE terms interviewers expect you to define. An SLO (service level objective) is a target such as "99.9 percent of requests succeed over 30 days". The error budget is the allowed failure that target leaves: 0.1 percent of requests, which over 30 days of 1 million requests per day is 30,000 failed requests, or about 43 minutes of full outage. While budget remains, the team ships; when it is spent, the team stops features and works on reliability. Toil is manual, repetitive, automatable work that scales with the service, such as resizing disks by hand. SRE teams cap toil and automate it away; that is where the engineering in the title comes from.
The platform engineer treats the internal platform as a product: it has users (developers), a roadmap, documentation, and a support channel. The goal is a golden path: a new service gets a repo, a pipeline, a Helm chart, dashboards and alerts from a template in under an hour, and nobody files a ticket.
DORA's four key metrics
DORA (DevOps Research and Assessment) has run a yearly survey of software teams for more than a decade. Its four key metrics are the standard way to measure delivery, and the standard interview question about measurement. Two measure throughput, two measure stability.
The fourth metric used to be called MTTR (mean time to restore). DORA renamed it because MTTR mixed in outages that no deployment caused. DORA also tracks a fifth value, deployment rework rate: the share of deployments that were unplanned and happened only to fix a user-facing bug.
Each year DORA clusters the survey answers into performance levels. The clusters are not pass marks that DORA sets in advance; they emerge from the data. These are the four clusters in the 2024 Accelerate State of DevOps report:
Read the table as a whole. Elite teams ship many times a day and still fail less often than everyone else. That is the central finding of the research, and the sentence to say in an interview: speed and stability are not a trade-off, they come from the same practices. Small changes are easier to test, easier to review and easier to roll back. (The 2024 medium cluster has a lower fail rate than the high cluster; the report presents it as it is, so quote it as it is.)
The survey-based metrics have a weakness: self-reported numbers. The code example below shows how to compute the same four numbers from your own deployment records, which is what a team dashboard should do.
The 12-factor app, and why containers need it
The twelve factors are a short list of rules for apps that run as services. They were written for a platform-as-a-service, and they are exactly what a container on Kubernetes needs.
Factors 3, 6, 9 and 11 come up in interviews most. Config in the environment is why Kubernetes has ConfigMaps and Secrets. Stateless processes are why a Deployment can kill any pod at any time. Disposability is why a rolling update works. Logs to stdout are why kubectl logs works at all.
The life of one change
Here is a change travelling from a pull request to production on a typical 2026 setup: GitHub, GitHub Actions, a container registry (ECR), Argo CD, EKS, Prometheus. Follow the story once and the tools in later lessons will have a place to go.
- Pull request. A developer pushes a branch that changes a payment service and opens a PR. The CI pipeline starts on the push.
- Build. The pipeline compiles the code and builds a container image from a multi-stage Dockerfile. The image gets a tag that is the commit SHA, never
latest, so every running pod can be traced to a commit.
# the build step, as the pipeline runs it
TAG="$(git rev-parse --short HEAD)"                       # 7 characters of the commit SHA
docker build -t "$REGISTRY/payments:$TAG" .               # one image, one commit
docker push "$REGISTRY/payments:$TAG"                     # staging and prod will run these bytes
- Test. Unit tests run in parallel jobs. Integration tests run against a database started in the pipeline. A failure blocks the merge; nobody has to remember to check.
- Scan. A scanner such as Trivy checks the image for known vulnerable packages and the repo for leaked secrets. A static analysis step checks the code. A critical finding fails the job.
- Artifact. The image is pushed to the registry and signed. Its SBOM (software bill of materials, a list of what is inside) is stored next to it. This is the one thing that will be deployed; staging and production run the same bytes.
- Merge and deploy. The PR is reviewed and merged. A commit updates the image tag in a deployment repository. Argo CD sees the change in Git and applies it to the cluster. This is GitOps: Git is the source of truth and the cluster follows it, so there is no
kubectl applyfrom a laptop. - Rollout. Kubernetes replaces pods a few at a time. New pods must pass a readiness probe before they receive traffic. A canary step sends 10 percent of traffic to the new version first.
- Observe. Dashboards and alerts watch error rate and latency for the new version. OpenTelemetry traces show where requests spend time.
- Rollback. The error rate for the canary rises above the threshold after 4 minutes. The rollout controller aborts and sends all traffic back to the old version. The developer sees the failure in the PR within minutes, not from a customer email the next day. Fixing it is a new PR, and the loop starts again.
The time from step 1 to step 8 is the lead time. Count how many steps needed a human: one review. Everything else is automated, which is why the team can do this 20 times a day.
Shift-left
"Shift-left" means moving a check earlier in that story, towards the left of the pipeline picture. Finding a vulnerable library at step 4 costs a failed job and five minutes. Finding it in production costs an incident, a postmortem and possibly a breach. The same rule applies to tests (run them on every PR, not before release), to security (scan in CI, not in a yearly audit), to cost (estimate the Terraform change in the PR with a tool such as Infracost) and to policy (reject a manifest with no resource limits at admission, not after it crashes a node).
The limit: some things can only be learned on the right, with real traffic, real data sizes and real failure. That is why the feedback loop exists and why a canary release is a check that runs in production on purpose.
What interviews actually test in 2026
Based on the public interview reports this roadmap is built from, the recurring areas are:
Indian IT services firms (TCS, Infosys, Wipro, Accenture, Capgemini) ask the basic versions: Docker commands, Linux permissions, a simple pipeline, kubectl basics, Jenkins (still common there; this roadmap teaches GitHub Actions and GitLab CI). Product companies ask the design and troubleshooting versions as a 45 minute scenario where you talk through what you would check and why.
How to use this roadmap
The roadmap has 31 lessons in 8 modules and 42 problems. The modules follow the pipeline picture: Foundations (Linux, shell, networking, Git, Python and Go), Build and ship (NGINX, Docker, CI/CD, deployment strategies), Cloud and IaC (AWS, EKS and ECS, Terraform, Ansible), Kubernetes (architecture, networking, production, Helm, GitOps), Operate (observability, SRE, troubleshooting, security, scaling), Contribute (Kubernetes internals in Go, CNCF and LFX), Ship (cost, the interview playbook) and Later.
Each lesson has a priority. STUDY lessons are the core: read the content, run the code example, do the practice tasks, answer the interview questions aloud. SKIM lessons (Ansible, cloud cost) are asked less often; read the summary and the interview questions. LATER lessons (service mesh and eBPF, GPU infrastructure, projects) matter for specific roles and for open-source work; do them after you can pass a Kubernetes troubleshooting round.
The problems are the interview itself. DESIGN problems are 45 minute whiteboard sessions, OPS problems are the scenario questions, CODE problems are take-home or live coding. After a STUDY lesson, attempt one of its related problems before reading the answer. One STUDY lesson per day gets you through Foundations, Build and ship, and Kubernetes in about three weeks, and the whole roadmap in about six.
Diagram
Worked example
An error budget for one month, with numbers. A checkout API handles 1.2 million requests per day. The team sets an availability SLO of 99.9 percent of requests succeed, measured over 30 days.
Step 1, total requests in the window: 1,200,000 x 30 = 36,000,000.
Step 2, allowed failures: 0.1 percent of 36,000,000 = 36,000 failed requests. That is the error budget.
Step 3, translate to time: if the service fails completely, it fails 1,200,000 / 1,440 = 833.3 requests per minute. 36,000 / 833.3 = 43.2 minutes. So the whole budget is about 43 minutes of full outage per month, or more partial outage spread over time.
Step 4, a bad deployment: on day 9 a release returns errors for 8 percent of requests for 25 minutes before the rollback finishes. Failed requests: 833.3 x 25 x 0.08 = 1,666.7, call it 1,667. The team spent 1,667 / 36,000 = 4.6 percent of the budget on that one incident.
Step 5, a slow dependency: on day 17 the payment provider times out for 1 in 40 requests for 6 hours. Failed requests: 833.3 x 360 x 0.025 = 7,500. That is 20.8 percent of the budget, more than four times the bad deploy, even though nobody noticed a "down" moment.
Step 6, the decision: budget used so far 1,667 + 7,500 = 9,167 of 36,000, or 25.5 percent, with 13 days left. The burn is on track, so features continue. If the second incident had lasted 24 hours instead of 6, it would have cost 30,000 requests, 83 percent of the budget, and the policy would say: stop feature work, add a timeout and a circuit breaker on the payment call, and fix the alert that took 6 hours to fire.
The lesson of the arithmetic: the loud incident (the deploy) cost less than the quiet one (the slow dependency). An SLO measured in requests makes that visible; "uptime" measured by a ping would have shown 100 percent on day 17.
Runnable code
"""Compute the four DORA metrics for one month from a list of deployments.

Each deployment is (timestamp, lead time in hours, failed, minutes to recover).
Lead time is commit to running in production. A deployment counts as failed
when it needed a hotfix, rollback or patch. The performance levels printed
next to each metric are the four clusters from the 2024 DORA report
(Elite, High, Medium, Low). They describe where the clusters sat, they are
not pass marks.
"""
from datetime import datetime, timedelta
from statistics import median

# 22 deployments in October 2026 for one service. Two of them needed a rollback.
DEPLOYS = [
    ("2026-10-01T10:15", 20, False, 0), ("2026-10-02T15:40", 6, False, 0),
    ("2026-10-05T09:05", 52, False, 0), ("2026-10-06T11:30", 9, False, 0),
    ("2026-10-07T16:10", 30, True, 45), ("2026-10-08T10:00", 4, False, 0),
    ("2026-10-09T14:25", 70, False, 0), ("2026-10-12T09:50", 18, False, 0),
    ("2026-10-13T13:15", 26, False, 0), ("2026-10-14T17:05", 8, False, 0),
    ("2026-10-15T10:40", 96, False, 0), ("2026-10-16T12:00", 12, False, 0),
    ("2026-10-19T09:30", 40, False, 0), ("2026-10-20T15:55", 7, False, 0),
    ("2026-10-21T11:20", 150, True, 360), ("2026-10-22T10:10", 5, False, 0),
    ("2026-10-23T14:45", 33, False, 0), ("2026-10-26T09:00", 16, False, 0),
    ("2026-10-27T13:30", 60, False, 0), ("2026-10-28T10:20", 11, False, 0),
    ("2026-10-29T16:40", 22, False, 0), ("2026-10-30T12:05", 3, False, 0),
]
MONTH_DAYS = 31  # October has 31 days

# Values of the four clusters in the 2024 report, for context.
CLUSTERS_2024 = {
    "lead time":          {"Elite": "less than one day", "High": "one day to one week",
                           "Medium": "one week to one month", "Low": "one to six months"},
    "deploy frequency":   {"Elite": "on demand, multiple per day", "High": "once per day to once per week",
                           "Medium": "once per week to once per month", "Low": "once per month to once per six months"},
    "change fail rate":   {"Elite": "5%", "High": "20%", "Medium": "10%", "Low": "40%"},
    "recovery time":      {"Elite": "less than one hour", "High": "less than one day",
                           "Medium": "less than one day", "Low": "one week to one month"},
}


def deployment_frequency(deploys, days):
    """Deploys per day over the month, and the matching 2024 cluster."""
    per_day = len(deploys) / days
    if per_day > 1:
        level = "Elite"
    elif per_day >= 1 / 7:
        level = "High"
    elif per_day >= 1 / 30:
        level = "Medium"
    else:
        level = "Low"
    return per_day, level


def lead_time(deploys):
    """Median lead time in hours (median, so one slow change does not hide the rest)."""
    hours = median(d[1] for d in deploys)
    if hours < 24:
        level = "Elite"
    elif hours < 24 * 7:
        level = "High"
    elif hours < 24 * 30:
        level = "Medium"
    else:
        level = "Low"
    return hours, level


def change_failure_rate(deploys):
    """Share of deployments that needed immediate intervention."""
    failed = sum(1 for d in deploys if d[2])
    return 100.0 * failed / len(deploys), failed


def recovery_time(deploys):
    """Median minutes to restore service after a failed deployment."""
    times = [d[3] for d in deploys if d[2]]
    if not times:
        return None, "no failed deployments"
    minutes = median(times)
    if minutes < 60:
        level = "Elite"
    elif minutes < 24 * 60:
        level = "High or Medium (both under one day in 2024)"
    else:
        level = "Low"
    return minutes, level


def longest_gap(deploys):
    """Longest stretch with no deployment, a hint that the pipeline was blocked."""
    stamps = sorted(datetime.fromisoformat(d[0]) for d in deploys)
    gaps = [b - a for a, b in zip(stamps, stamps[1:])]
    return max(gaps, default=timedelta(0))


if __name__ == "__main__":
    per_day, f_level = deployment_frequency(DEPLOYS, MONTH_DAYS)
    hours, l_level = lead_time(DEPLOYS)
    cfr, failed = change_failure_rate(DEPLOYS)
    rec, r_level = recovery_time(DEPLOYS)

    print(f"deployments in the month : {len(DEPLOYS)} over {MONTH_DAYS} days")
    print(f"deployment frequency     : {per_day:.2f} per day = {per_day * 7:.1f} per week -> {f_level}")
    print(f"lead time for changes    : median {hours:.0f} h = {hours / 24:.1f} days -> {l_level}")
    print(f"change failure rate      : {failed} of {len(DEPLOYS)} = {cfr:.1f}% "
          f"(2024 clusters: Elite 5%, High 20%, Medium 10%, Low 40%)")
    print(f"failed deploy recovery   : median {rec:.0f} min -> {r_level}")
    print(f"longest gap between deploys: {longest_gap(DEPLOYS)}")
    print("\n2024 cluster values, for comparison:")
    for metric, levels in CLUSTERS_2024.items():
        print(f"  {metric:17s} " + " | ".join(f"{k}: {v}" for k, v in levels.items()))

    # Self-checks: the numbers above must be reproducible by hand.
    assert len(DEPLOYS) == 22
    assert abs(per_day - 22 / 31) < 1e-9 and f_level == "High"
    assert hours == 19 and l_level == "Elite"          # median of the 22 lead times
    assert failed == 2 and abs(cfr - 100 * 2 / 22) < 1e-9
    assert rec == 202.5 and r_level.startswith("High")  # median of 45 and 360
    print("\nself-checks passed: frequency High, lead time Elite, 9.1% failures, recovery under one day")
Key takeaways
DevOps is a way of working, not a team or a tool: shared ownership of a service, an automated path from commit to production, and fast feedback from production.
The delivery pipeline is the forward arrow (build, test, scan, artifact, deploy); observability is the backward arrow. You need both.
DevOps engineers own the path, SREs own reliability with SLOs, error budgets and on-call, platform engineers build the internal platform as a product for other teams.
The four DORA metrics are change lead time, deployment frequency, change fail rate and failed deployment recovery time; the 2024 elite cluster ships on demand with a 5 percent fail rate and recovers in under an hour.
Speed and stability come from the same practices: small changes, automated tests, fast rollback.
The 12-factor rules (config in the environment, stateless processes, fast start and graceful stop, logs to stdout) are what a container needs to run well on Kubernetes.
Shift-left moves checks earlier where they are cheap; canaries are the check that must run on the right, in production.
Study STUDY lessons fully, skim SKIM ones, attempt a related problem after each lesson.
Common mistakes
Answering "what is DevOps" with a list of tools. Describe the flow and the ownership; name tools only as examples.
Saying SRE and DevOps are the same job. SRE is a specific practice with SLOs, error budgets and a toil cap; it is one way to do the operations half of DevOps.
Quoting MTTR as a DORA metric. The current name is failed deployment recovery time, and it counts only recovery from failed deployments.
Treating speed and stability as a trade-off. The research shows elite teams are better at both; small batches are the reason.
Describing a pipeline that ends at "deploy". Without observe and rollback it is half a pipeline.
Skipping the Linux and shell lessons because Kubernetes sounds more important. Most Kubernetes troubleshooting ends in a shell on a node.
Practice
Pick any public open-source service you use and write its change lifecycle as the nine steps in this lesson, naming the real tools from its repository (CI config, Dockerfile, release process). Result: a one-page document that an interviewer could read in two minutes.
Take the code example, replace the sample data with 30 made-up deployments where one week has no deploys and three failures happen on one day, and confirm by hand that the four printed numbers are right. Then change the script to compute a weekly deployment frequency instead of monthly.
Compute an error budget for a service of your choice: pick an SLO, a request rate, and two incidents of different shapes (one short full outage, one long partial degradation), and work out which spent more budget. Write the arithmetic out as in the worked example.
Set up the free accounts you will need for the rest of the roadmap: GitHub, Docker Hub or GitHub Container Registry, and an AWS free-tier account with a billing alarm at 5 USD. Then open the Missing Semester course page and read the shell lecture before lesson 3.
Interview questions (10)
1.What is DevOps to you?Easy
DevOps is a way of working where the same team writes, deploys and runs a service, and where the path from a commit to production is automated and measured. The goal is to shorten that path and to make it safe: every change is built, tested, scanned, packaged and deployed by a pipeline, and what production sees comes back to the team through metrics, logs and traces. It is not a team that sits between developers and operations and it is not a set of tools; the tools such as GitHub Actions, Terraform and Kubernetes make the practices cheaper, but the practices are shared ownership, automation and fast feedback.
2.What is the difference between a DevOps engineer, an SRE and a platform engineer?Easy
A DevOps engineer owns the delivery path: pipelines, build and deploy automation, infrastructure as code, environments. Their success is measured by the DORA metrics. An SRE owns reliability: they set SLOs with the product team, track the error budget, run on-call and postmortems, and spend engineering time removing toil so the same people can run more services. A platform engineer builds the internal developer platform, the cluster, templates, golden paths and self-service tools, and treats it as a product with developers as users; success is adoption and how fast a new service reaches production. In a small company one person does all three. In a large one they are three teams.
3.How would you measure whether a team delivers software well?Medium
I would use the four DORA metrics, two for throughput and two for stability. Change lead time is the time from commit to running in production. Deployment frequency is how often production changes. Change fail rate is the share of deployments that needed a hotfix, rollback or patch. Failed deployment recovery time is how long that recovery took. I would compute them from real data, deployment events from the CD system and incident records, not from a survey, and put them on a dashboard per service. The DORA research shows the elite cluster deploys on demand with a lead time under a day and still has the lowest fail rate, so I would not accept "we deploy less to be safe" as a strategy.
4.What is an error budget and how does it change behaviour?Medium
An error budget is the failure an SLO allows. With a 99.9 percent availability SLO over 30 days, 0.1 percent of requests may fail; for a service doing 1.2 million requests a day that is 36,000 requests, or about 43 minutes of full outage. The budget turns reliability from an argument into a number. While budget remains, the team ships features and takes risks such as a big migration. When the budget is spent, the agreed policy says feature work pauses and the team works on reliability: better tests, slower rollouts, fixing the alert that fired late. It also gives the on-call engineer a reason to page: a burn rate that would exhaust the budget in a day is worth waking someone; a slow burn is a ticket.
5.Walk me through what happens after a developer merges a pull request.Medium
Ideally the pipeline already ran on the PR: build the container image tagged with the commit SHA, run unit and integration tests, scan the image for vulnerabilities and the repo for secrets, push and sign the image, store the SBOM. On merge, a commit updates the image tag in the deployment repository. Argo CD notices the Git change and applies the new manifests to the cluster, so nobody runs kubectl from a laptop. Kubernetes replaces pods a few at a time; each new pod must pass its readiness probe before it gets traffic. A canary sends a small share of traffic to the new version while dashboards watch error rate and latency. If those cross a threshold the rollout aborts and traffic goes back to the old version; otherwise it proceeds to 100 percent. Metrics, logs and traces then flow back to the team.
6.What does shift-left mean and where does it stop working?Easy
Shift-left means moving a check earlier in the pipeline, where failure is cheap. Run tests on every pull request, not before a release. Scan images for CVEs and the repo for secrets in CI, not in a yearly audit. Estimate the cost of a Terraform change in the PR. Reject manifests without resource limits at admission time. Each of those catches a problem before it reaches a user. It stops working for things that only exist on the right: real traffic patterns, real data volumes, a dependency that slows down under load. For those you need checks that run in production on purpose, such as canary releases with automated analysis and SLO-based alerts, and a fast rollback path.
7.Why does the 12-factor app matter for containers and Kubernetes?Medium
The twelve factors describe an app that a platform can start, stop, move and scale without caring what is inside, which is exactly what Kubernetes assumes. Config in the environment is why ConfigMaps and Secrets are injected as environment variables rather than baked into the image. Stateless processes are why a Deployment can kill any pod at any time and why HPA can add a copy. Fast startup and graceful shutdown on SIGTERM are why a rolling update does not drop requests. Logs as an event stream to stdout are why kubectl logs and a log collector work. An app that keeps sessions in memory, reads config from a file inside the image and writes logs to /var/log inside the container will run on Kubernetes, but every one of those features will hurt it.
8.Your team deploys once a month and the last two releases caused outages. What would you change first?Hard
The monthly release is the cause, not the cure. A month of changes in one deployment means hundreds of commits, so when it breaks nobody knows which one did it and the rollback undoes a month of work. I would start by making deployment boring: build a pipeline that builds and tests every PR and produces an image tagged with the commit, add readiness probes and a rollback command that works in under five minutes, and then deploy small batches, first weekly, then daily. I would measure lead time, frequency, fail rate and recovery time from the start so the improvement is visible. In parallel, a postmortem on the two outages usually finds a missing test or a missing alert, which goes into the pipeline. The DORA data says this moves fail rate down, not up.
9.What is toil and why do SRE teams measure it?Easy
Toil is manual, repetitive, automatable operational work that scales with the service and produces no lasting value: resizing a disk by hand, rotating a credential from a runbook, restarting a service after every deploy. SRE teams measure it because toil grows with the number of services, so a team that does not cap it ends up doing only toil and never engineering. The usual rule is that toil should stay under half of an SRE's time; above that the team stops taking on new services and automates. A good interview example is turning a runbook step into a script, then into a controller that does it without a human.
10.A production incident is fixed. What happens next and why?Medium
A blameless postmortem. The team writes down the timeline, the impact in SLO terms (how much error budget was spent), the root cause and the contributing causes, what went well, and action items with owners and dates. Blameless means the question is "what about the system let this happen", not "who did it", because a person who fears blame hides the detail that would prevent the next incident. The action items go into the backlog with priority, typically a missing alert, a missing test, a slow rollback or a missing limit. The postmortem is shared widely so other teams learn from it. Without this step the same incident repeats, and the error budget is spent twice on one lesson.
Quiz
1.Which of these is a DORA key metric as currently defined?
2.In the 2024 DORA report, what deployment frequency and change fail rate did the elite cluster show?
3.Which 12-factor rule is the reason Kubernetes ConfigMaps and Secrets exist?
4.A service has a 99.9 percent availability SLO over 30 days and serves 1,000,000 requests per day. What is its error budget?
5.What is the main job of a platform engineer?
6.What is the difference between the delivery pipeline and the feedback loop?
Practice these problems
Further reading
My notes
Your notes
Autosaves to this browser.