Linux for operators
Every container, every Kubernetes node and almost every CI runner is a Linux machine. This lesson is the operator's view of Linux: where files live, who may touch them, how processes are born and killed, how systemd keeps a service running, where logs go, and how to read disk, memory, CPU and load numbers when something is wrong. It ends with the kernel features (cgroups and namespaces) that containers are made of.
Why it matters
Linux questions open most DevOps interviews in India, from TCS and Infosys to product startups: "what does a load average of 8 mean", "the disk is full but rm did not free space", "what is the difference between kill -9 and kill -15", "write a systemd unit". They are also where every Kubernetes incident ends: a pod is OOMKilled because of a cgroup limit, a node is NotReady because the disk filled, a container cannot start because of a file permission. An engineer who can read free, ss and journalctl on a node fixes in minutes what others escalate.
Read first: DevOps, SRE and platform engineering - how software reaches production
Lesson
The filesystem: where things live
Linux has one tree starting at /; disks, devices and running processes all appear somewhere in it. The directories an operator opens every week:
A file on disk is an inode (the metadata: owner, permissions, size, where the data blocks are) plus a name in a directory that points to it. A hard link (ln a b) is a second name for the same inode; the data is deleted only when the last name is removed and no process has it open. A soft link or symlink (ln -s a b) is a small file containing a path; it can point across filesystems and it breaks if the target moves. ls -li shows the inode number and the link count.
Users, groups and permissions
Every process runs as a user ID (UID) and belongs to groups. Every file has an owner, a group and three permission sets: owner, group, others, each with read (4), write (2), execute (1). -rwxr-x--- is 750: owner everything, group read and run, others nothing. On a directory, execute means "may enter" and read means "may list".
ls -l /etc/ssh/sshd_config          # -rw-r--r-- root root: read by all, written by root
chmod 600 ~/.ssh/id_ed25519         # private key: owner only, or ssh refuses to use it
chmod 755 /opt/app/bin/server       # everyone may run it, only owner may change it
chown -R app:app /var/lib/app       # hand a directory to the service user
id app                              # uid, gid and groups of a user
Three special bits. setuid (chmod u+s, shown as s in the owner's execute slot) makes a program run with the file owner's UID instead of the caller's; /usr/bin/passwd is setuid root so a user can edit /etc/shadow through it. setgid on a directory makes new files inherit its group, for shared project directories. The sticky bit on /tmp (drwxrwxrwt) lets everyone create files but only the owner delete their own.
sudo runs one command as root (or another user with -u) and logs it to /var/log/auth.log. Who may use it is in /etc/sudoers and /etc/sudoers.d/, edited only with visudo because a syntax error there locks everyone out. A service runs as its own unprivileged user, never as root.
Processes: PIDs, fork, exec and signals
A process is a running program with a PID, a parent PID (PPID), a UID, open file descriptors, an environment and a working directory. New processes come from two system calls: fork copies the current process, exec replaces its program. When you type nginx in a shell, the shell forks and the child execs nginx. PID 1 is systemd, the ancestor of everything.
You talk to a process with signals. The three that matter:
Kubernetes and systemd both send SIGTERM, wait (30 seconds by default in Kubernetes, 90 in systemd), then SIGKILL. A service that ignores SIGTERM is killed mid-request on every deploy; that is the 12-factor disposability rule.
ps aux --sort=-%mem | head -5                # top memory users; STAT column: R running, S sleeping, D disk wait, Z zombie
top -o %CPU                                   # live view; press 1 to see each CPU, M to sort by memory
htop                                          # same, with colours and a tree view
pgrep -a java                                 # PIDs and commands matching a name
kill -TERM 1821; sleep 10; kill -0 1821 && kill -KILL 1821   # polite, then forceful; -0 only checks it exists
nice -n 10 ./backup.sh                        # lower priority; renice -n 5 -p PID changes a running one
A zombie (state Z) has exited but its parent has not read its exit status with wait. It uses no memory, only a PID, and you cannot kill it; you fix or kill its parent. Thousands of zombies in a container usually mean PID 1 is an app that never calls wait (use tini or --init).
systemd: keeping a service running
systemd is the init system on Ubuntu and every major distribution. It starts services in dependency order, restarts them when they fail, and collects their output. A unit is a thing it manages: a .service (a daemon), a .timer (a scheduled run), a .socket, a .mount, a .target (a group). Your unit files go in /etc/systemd/system/.
A complete unit for a Go or Node API:
# /etc/systemd/system/orders-api.service
[Unit]
Description=Orders API
After=network-online.target          # start after the network is up
Wants=network-online.target
StartLimitIntervalSec=60             # at most 5 restarts in 60 s, then give up and stay failed
StartLimitBurst=5

[Service]
Type=simple                          # ExecStart is the service; notify for apps that send READY=1
User=orders                          # never root
Group=orders
WorkingDirectory=/opt/orders
EnvironmentFile=/etc/orders/env      # PORT=8080, DATABASE_URL=... config in the environment
ExecStart=/opt/orders/bin/orders-api # for Node: /usr/bin/node /opt/orders/server.js
Restart=on-failure                   # restart on non-zero exit or a signal, not on a clean exit 0
RestartSec=2                         # wait 2 s between restarts (default is 100 ms)
TimeoutStopSec=20                    # SIGTERM, then SIGKILL after 20 s (default 90 s)
KillSignal=SIGTERM
MemoryMax=512M                       # cgroup hard limit; OOM killer acts inside this cgroup
CPUQuota=150%                        # at most 1.5 CPUs
TasksMax=512                         # cap threads and child processes
LimitNOFILE=65536                    # open file descriptors; default 1024 is too low
NoNewPrivileges=true                 # no setuid escalation from inside
ProtectSystem=full                   # /usr, /boot and /etc read-only for this service
PrivateTmp=true                      # its own /tmp

[Install]
WantedBy=multi-user.target           # "enable" links it into the normal boot target
The commands:
sudo systemctl daemon-reload                 # after editing any unit file
sudo systemctl enable --now orders-api       # start now and on every boot
systemctl status orders-api                  # active/failed, main PID, memory, last 10 log lines
sudo systemctl restart orders-api            # stop (SIGTERM, wait, SIGKILL) then start
systemctl list-units --type=service --state=failed
journalctl -u orders-api -f                  # follow this unit's log
journalctl -u orders-api --since "1 hour ago" -p err   # errors in the last hour
journalctl -b -1                             # the previous boot, for "why did the server reboot"
systemctl show orders-api -p MemoryCurrent   # what the cgroup says it uses now
Restart=on-failure with StartLimitBurst is the systemd version of CrashLoopBackOff: a crashing service restarts a few times, then systemd gives up and systemctl status shows failed with start-limit-hit; systemctl reset-failed clears it.
Packages and why you pin versions
Ubuntu uses apt with .deb packages; RHEL, Fedora and Amazon Linux use dnf with .rpm:
sudo apt update && sudo apt install -y nginx="$VERSION"   # pin the exact string that apt-cache policy shows
apt-mark hold nginx                                             # refuse upgrades
dpkg -L nginx | head                                            # files a package installed
dpkg -S /usr/sbin/nginx                                         # which package owns a file
sudo dnf install -y nginx-"$VERSION"                           # the dnf equivalent
You pin because an unpinned install gives you whatever is newest on the day the image or server is built: two nodes built a week apart run two versions, and the bug is on only one. Pin in Dockerfiles, Ansible and CI, and bump the pin on purpose. Security patches through unattended-upgrades are the exception you turn on deliberately.
Logs: /var/log and journald
Two log systems live side by side on Ubuntu. journald collects stdout and stderr of every systemd unit plus kernel messages into a binary, indexed store; journalctl reads it. rsyslog writes classic text files: /var/log/syslog (everything), /var/log/auth.log (logins, sudo), /var/log/kern.log. Applications with their own files use /var/log/<app>/, and logrotate (config in /etc/logrotate.d/) rotates and compresses them so they do not fill the disk. For a service you write, print to stdout and let journald or the container runtime collect it: 12-factor rule 11, and the reason kubectl logs works.
Disk: df, du, lsof, inodes, mounts
df -h                              # per filesystem: size, used, available, mount point
df -i                              # inodes: a disk can be "full" with free bytes if inodes run out
sudo du -xsh /var/* | sort -h | tail -5   # which directory is big; -x stays on one filesystem
sudo lsof +L1                      # deleted files still held open: the classic "rm freed nothing"
lsblk                              # disks, partitions and where they are mounted
findmnt /var/lib/docker            # is this its own mount, and from which device
The "disk is full but I deleted the file" case: a process still has the file open, so the inode and its blocks stay until the process closes it. lsof +L1 (link count less than 1) lists them. Fix: restart the process, or truncate the file in place with : > /proc/PID/fd/N. Never delete a log that is being written; truncate it.
Inode exhaustion looks like "No space left on device" while df -h shows free space; df -i shows 100 percent. The cause is millions of tiny files: session files, mail queues, a cache directory. Find them with find /var -xdev -type f | cut -d/ -f1-3 | sort | uniq -c | sort -n | tail.
/etc/fstab lists what is mounted at boot; one wrong line (a disk that no longer exists, without nofail) stops the boot at an emergency shell. Mount cloud data disks by UUID from blkid, never by /dev/sdX names, which can change between boots.
Memory: free, the page cache and the OOM killer
free -h                            # total, used, free, shared, buff/cache, available
head -3 /proc/meminfo              # the numbers free reads
vmstat 1 5                         # si/so columns: swapping, a sign of memory pressure
sudo dmesg -T | grep -i oom       # did the OOM killer run, and whom did it kill
cat /proc/1821/oom_score /proc/1821/oom_score_adj  # how likely this process is to be chosen
Two rules. First, free is not available. Linux uses spare RAM as a page cache for file data, so free is always small on a healthy server and that is good. The available column (MemAvailable in /proc/meminfo) is what a new process could get, including cache the kernel would drop. Alarm on available, not on free. Second, when available memory and swap are both gone, the kernel's OOM killer picks one process and sends it SIGKILL. The victim is the one with the highest oom_score, roughly its share of RAM plus oom_score_adj (from -1000, never kill, to +1000). So the biggest process dies, usually the database or the JVM you cared about most. Protect it with a negative oom_score_adj (systemd: OOMScoreAdjust=-900). Inside a container the same killer runs against the cgroup's memory limit; that is where OOMKilled in kubectl describe pod comes from.
CPU: load average versus utilisation
uptime prints three load averages: the average number of tasks that were runnable (wanting CPU) or in uninterruptible sleep (waiting on disk or NFS, state D) over the last 1, 5 and 15 minutes. It is a count, not a percentage, so it means nothing until you divide by the CPU count from nproc.
A load of 8 on 4 cores means that on average 8 tasks wanted to run and only 4 could: every CPU was busy and 4 tasks were queued. The same 8 on 16 cores is a quiet machine. The three numbers give the direction: 8, 6, 3 means the problem started minutes ago; 3, 6, 8 means it is easing. High load with low CPU usage in top means tasks in D state: a slow disk, a hung NFS mount. top shows the split: us user, sy kernel, wa waiting on I/O, st stolen by the hypervisor (a noisy neighbour, or a burstable instance out of credits).
Networking on the host, in one line each
The networking lesson goes deep; these are the commands you run on a node first.
ss -tlnp                          # listening TCP sockets with the process that owns each
ss -tan state established | wc -l # open connections right now
ip addr; ip route                 # addresses on each interface; the default gateway
dig +short api.internal           # what DNS answers, from this host's resolver
curl -sv --max-time 5 127.0.0.1:8080/healthz -o /dev/null   # is the service answering locally
sudo tcpdump -ni eth0 port 5432 -c 20      # the packets; -n no DNS, -c stop after 20
cgroups and namespaces: what a container is
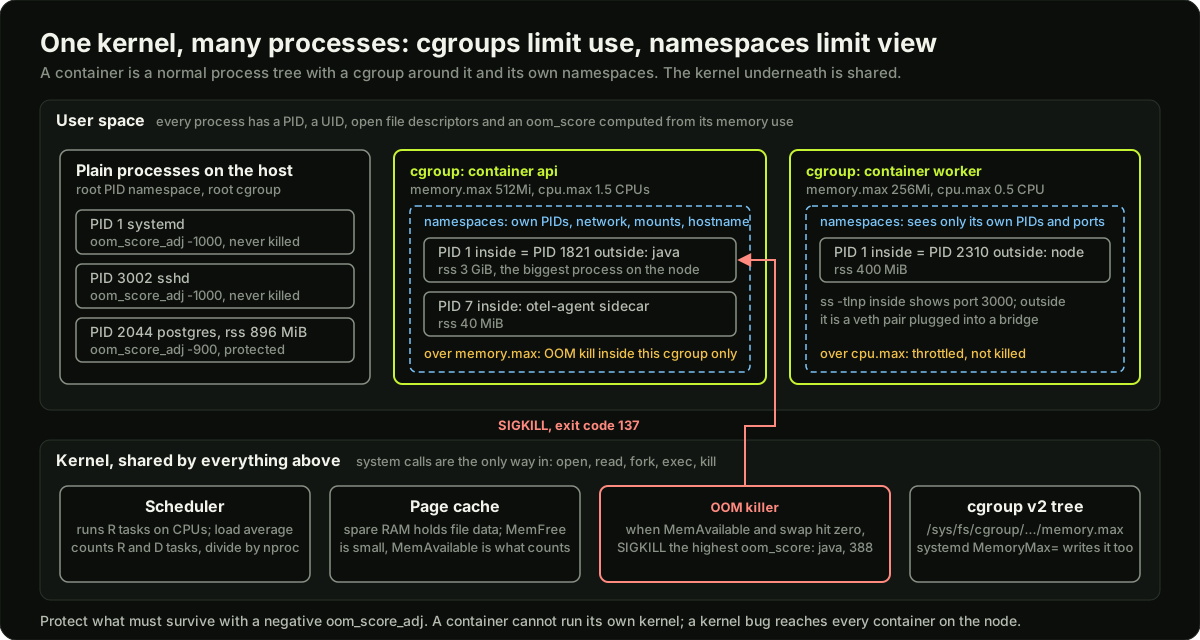 User space processes above the kernel, with cgroups limiting CPU and memory, namespaces giving each container its own view, and the OOM killer choosing the process with the highest oom_score
A container is not a virtual machine. It is a normal Linux process (or tree of processes) that the kernel treats specially in two ways.
cgroups (control groups) limit what a group of processes may use: CPU time, memory, I/O bandwidth, number of PIDs. A Kubernetes memory limit of 512Mi becomes a memory.max file under /sys/fs/cgroup/ for that container, enforced by the OOM killer. CPU limits become cpu.max (a quota per period), which is why they show up as throttling, not a crash. systemd's MemoryMax= and CPUQuota= are the same mechanism for a plain service.
Namespaces limit what a process may see: its own PID tree (PID 1 inside is not PID 1 outside), network interfaces and ports, mount table and root filesystem, hostname, user IDs. kubectl exec enters those namespaces; nsenter -t PID -n ss -tlnp on the node does it by hand.
Add a filesystem image built from layers and a runtime (containerd) that sets this up, and you have Docker. What is shared is the kernel: a container cannot run a different one, and a kernel bug affects every container on the node.
SSH keys and config
ssh-keygen -t ed25519                                   # ~/.ssh/id_ed25519 and .pub; never share the private one
ssh-copy-id -i ~/.ssh/id_ed25519.pub ubuntu@10.0.1.20   # appends the public key to ~/.ssh/authorized_keys there
# ~/.ssh/config: so the long command becomes "ssh prod-web-1"
Host prod-web-*
    User ubuntu
    ProxyJump bastion.example.com
    IdentityFile ~/.ssh/id_ed25519
    ServerAliveInterval 30
On the server, /etc/ssh/sshd_config should have PasswordAuthentication no and PermitRootLogin no; ~/.ssh must be 700 and authorized_keys 600 or sshd ignores them.
Symptom to first command
Diagram
Worked example
A 4-core web server at 9 am. You are paged: p99 latency on the API tripled. You SSH in and run three commands.
uptime prints load average: 8.12, 6.40, 3.05. nproc prints 4. So 8.12 / 4 = 2.03 tasks per CPU: every core is busy and on average about 4 tasks are waiting. The 15-minute value is 3.05, close to the core count, so the machine was fine 15 minutes ago; this is new.
top shows the CPU line us 31.0, sy 4.0, wa 61.5, st 0.0. CPU is mostly idle waiting on I/O (wa), not computing. High load with high wa means tasks are in D state waiting for a disk. The process list has three postgres backends in state D and a pg_dump started at 08:58 by a cron job.
free -h shows total 7.7 GiB, used 2.6 GiB, buff/cache 4.9 GiB, available 4.6 GiB. Memory is fine. The 4.9 GiB of cache is normal and is not the problem; if you had read the free column (280 MiB) you would have chased a ghost.
iostat -x 1 3 (from sysstat) shows the data disk at 99 percent utilisation with 40 ms average wait. The nightly dump was moved to 9 am by someone's cron edit, and it is reading the whole database at the same time the morning traffic arrives.
The fix path: sudo kill -TERM $(pgrep pg_dump) stops the dump cleanly (pg_dump handles SIGTERM; -9 would leave a half-written file). Within a minute, uptime shows 4.9, 6.1, 3.8 and falling. Then the proper fix: move the cron entry back to 02:00, run the dump with nice -n 19 ionice -c 3 so it yields to real traffic, and add an alert on wa above 30 percent for 5 minutes. Finally, write the timeline into the incident ticket: 08:58 cron ran, 09:02 latency alert, 09:07 cause found, 09:08 dump stopped, 09:09 latency back to normal. Time to diagnose: 5 minutes, because you divided load by cores and looked at wa before touching anything.
Runnable code
"""Explain a Linux host from /proc-style text, the way `free`, `uptime` and `top` do.

The script parses a /proc/meminfo snapshot, a /proc/loadavg line and a few
/proc/<pid>/status entries. Everything is a string in this file, so it runs
anywhere without root. Swap the strings for open('/proc/meminfo').read()
on a real Ubuntu host and the same code works.
"""

MEMINFO = """\
MemTotal:        8089536 kB
MemFree:          286412 kB
MemAvailable:    4815276 kB
Buffers:          203540 kB
Cached:          4617288 kB
SwapCached:            0 kB
Active:          3980112 kB
Inactive:        2742516 kB
SwapTotal:       2097148 kB
SwapFree:        2097148 kB
Dirty:              1240 kB
Shmem:            125408 kB
Slab:             412764 kB
SReclaimable:     301152 kB
"""

# /proc/loadavg: 1, 5 and 15 minute load, running/total tasks, last PID
LOADAVG = "8.12 6.40 3.05 3/612 48213"
NPROC = 4  # CPUs on this host, what `nproc` prints

# Selected lines from /proc/<pid>/status for the biggest processes (VmRSS in kB)
PROCESSES = {
    1821: {"Name": "java", "VmRSS": 3145728, "oom_score_adj": 0},
    2044: {"Name": "postgres", "VmRSS": 917504, "oom_score_adj": -900},
    2310: {"Name": "node", "VmRSS": 409600, "oom_score_adj": 0},
    1: {"Name": "systemd", "VmRSS": 12288, "oom_score_adj": -1000},
    3002: {"Name": "sshd", "VmRSS": 8192, "oom_score_adj": -1000},
}


def parse_meminfo(text):
    """Turn 'MemTotal: 8089536 kB' lines into a dict of kB integers."""
    out = {}
    for line in text.splitlines():
        key, _, rest = line.partition(":")
        out[key.strip()] = int(rest.split()[0])
    return out


def explain_memory(m):
    total, free, avail = m["MemTotal"], m["MemFree"], m["MemAvailable"]
    cache = m["Buffers"] + m["Cached"] + m["SReclaimable"]
    # `free` prints used = total - free - buffers/cache.
    used = total - free - cache
    print(f"memory: total {total/1024/1024:.1f} GiB, free {free/1024:.0f} MiB, "
          f"page cache and reclaimable slab {cache/1024/1024:.1f} GiB")
    print(f"        used by processes {used/1024/1024:.1f} GiB, available {avail/1024/1024:.1f} GiB")
    print("        MemFree is small on purpose: the kernel keeps file data in RAM as cache "
          "and gives it back when a process asks.")
    print("        Watch MemAvailable, not MemFree. The OOM killer wakes up when MemAvailable "
          "reaches zero and swap is gone.")
    swap_used = m["SwapTotal"] - m["SwapFree"]
    print(f"        swap used {swap_used/1024:.0f} MiB of {m['SwapTotal']/1024:.0f} MiB")
    return used, avail


def explain_load(line, ncpu):
    l1, l5, l15, tasks, _ = line.split()
    l1, l5, l15 = float(l1), float(l5), float(l15)
    running, total = tasks.split("/")
    print(f"\nload average: {l1} (1 min) {l5} (5 min) {l15} (15 min) on {ncpu} CPUs, "
          f"{running} runnable of {total} tasks")
    per_cpu = l1 / ncpu
    print(f"        {l1} / {ncpu} CPUs = {per_cpu:.2f} runnable or uninterruptible tasks per CPU")
    if per_cpu > 1:
        print(f"        every CPU is busy and on average {l1 - ncpu:.1f} tasks are waiting for one")
    trend = "rising" if l1 > l15 else "falling"
    print(f"        1 min above 15 min: the load is {trend}; this started recently")
    print("        load counts tasks in state R (want CPU) and D (waiting on disk or NFS), "
          "so a high load with idle CPUs means I/O wait")
    return per_cpu


def rank_oom_victims(procs, total_kb):
    """Approximate the kernel's choice: rss share of RAM, shifted by oom_score_adj.

    The real oom_score is (rss + swap + page tables) / total * 1000 + oom_score_adj,
    with -1000 meaning never kill. This is close enough to show who dies first.
    """
    ranked = []
    for pid, p in procs.items():
        if p["oom_score_adj"] == -1000:
            score = 0
        else:
            score = max(0, int(p["VmRSS"] / total_kb * 1000) + p["oom_score_adj"])
        ranked.append((score, pid, p))
    ranked.sort(reverse=True)
    print("\nOOM killer order (highest oom_score dies first):")
    for score, pid, p in ranked:
        print(f"        pid {pid:5d} {p['Name']:9s} rss {p['VmRSS']/1024:6.0f} MiB "
              f"adj {p['oom_score_adj']:5d} -> oom_score {score}")
    return ranked


if __name__ == "__main__":
    m = parse_meminfo(MEMINFO)
    used, avail = explain_memory(m)
    per_cpu = explain_load(LOADAVG, NPROC)
    ranked = rank_oom_victims(PROCESSES, m["MemTotal"])

    # Self-checks: every number above is reproducible by hand.
    assert used == 8089536 - 286412 - (203540 + 4617288 + 301152) == 2681144
    assert avail == 4815276
    assert abs(per_cpu - 8.12 / 4) < 1e-9 and per_cpu > 2
    assert ranked[0][2]["Name"] == "java" and ranked[0][0] == 388     # 3145728/8089536*1000 = 388
    assert ranked[1][2]["Name"] == "node" and ranked[1][0] == 50      # 409600/8089536*1000 = 50
    assert all(p["oom_score_adj"] != -1000 or s == 0 for s, _, p in ranked)
    print("\nself-checks passed: used 2.6 GiB, load 2.03 per CPU, java is the first OOM victim, "
          "postgres is protected by its negative oom_score_adj")
Key takeaways
Config in
/etc, logs in/var/logand journald, state in/var/lib, the kernel's live view in/procand/sys.A file is an inode plus names; deleting a name does not free space while a process holds the file open.
lsof +L1finds those.Permissions are owner, group, others with rwx; services run as their own user;
sudois logged; setuid is howpasswdworks.SIGTERM asks, SIGKILL forces, SIGHUP usually reloads. systemd and Kubernetes send TERM first and KILL after a timeout.
A systemd unit with
Restart=on-failure,MemoryMax,CPUQuotaand a non-rootUseris the baseline for any service on a VM;journalctl -uis where its logs are.Alarm on MemAvailable, not MemFree; the page cache is supposed to use spare RAM. The OOM killer picks the highest oom_score, usually your biggest process.
Load average is a task count: divide by
nproc. High load with low CPU use means I/O wait or D-state tasks.Containers are processes under cgroups (limits on use) and namespaces (limits on view), sharing the host kernel.
Common mistakes
Reading the
freecolumn and declaring the server out of memory whileavailableshows gigabytes.Quoting a load average without the CPU count. 8 on 4 cores is a problem; 8 on 32 is idle.
Reaching for
kill -9first. The process never closes files or connections, and if it is the parent of others they become orphans or zombies.Deleting an open log file to free space. Truncate it instead, or restart the writer.
Running a service as root, or writing a unit without
Restart=,User=and resource limits.Installing packages unpinned in a Dockerfile or an Ansible role, so two builds a week apart differ.
Practice
On an Ubuntu VM or a Docker container running
ubuntu:24.04, write theorders-api.serviceunit for a tiny Python HTTP server (python3 -m http.server 8080), enable it, kill its PID withkill -9, and confirm withsystemctl statusandjournalctl -uthat systemd restarted it; then make it crash on purpose five times in a minute and observestart-limit-hit.Reproduce the deleted-but-open file problem: in one shell run
python3 -c "f=open('/tmp/big','w'); import time; f.write('x'*10**8); f.flush(); time.sleep(600)", in anotherrm /tmp/big, comparedf -h /tmpbefore and after, find the holder withlsof +L1, and free the space with the/proc/PID/fdtruncate trick.Work through the Linux Journey "Grasshopper" sections on the command line, permissions and processes, then do OverTheWire Bandit levels 0 to 12 (ssh to
bandit.labs.overthewire.orgport 2220 asbandit0); each level is one filesystem or permissions idea from this lesson. Record which commands solved each level.On a laptop or VM run
docker run --rm -m 128m python:3.12-slim python3 -c "x=bytearray(300*1024*1024)"and read the exit code (137) anddmesgordocker inspectto see the OOM kill against the cgroup limit; then runcat /sys/fs/cgroup/memory.maxinside a container started with-m 128mto see the number the kernel enforces.
Interview questions (12)
1.Walk me through the Linux boot process, and where you look when a server does not come back after a reboot.Medium
Firmware first: UEFI (or BIOS on old machines) runs its self-test and starts the bootloader from the EFI system partition. The bootloader, usually GRUB 2, loads the kernel and the initramfs into memory with the kernel command line. The kernel sets up memory and drivers, then runs the initramfs, a tiny filesystem whose job is to find and mount the real root filesystem (load storage drivers, unlock LVM or encryption) and switch to it. Then the kernel starts PID 1, which is systemd. systemd reads the default target, usually multi-user.target on a server, and starts units in parallel by their dependencies: mounts from /etc/fstab, networking, sshd, your services. When it fails, I check where it stopped: journalctl -b -1 for the previous boot, systemctl --failed, systemd-analyze blame for slow units, and dmesg for kernel and disk errors. The classic causes are a bad /etc/fstab line (add nofail for non-critical mounts) and a full disk. On EC2, where there is no screen, I read the serial console or aws ec2 get-console-output.
2.What does a load average of 8 on a 4-core server mean, and what do you check next?Easy
Load average is the average number of tasks that are runnable or in uninterruptible sleep, so 8 on 4 cores means every core was busy and on average 4 more tasks were waiting. It is a count, not a percentage, so I always divide by nproc. Next I look at the three values to see the direction, then at top to see whether the CPU time is user, system, I/O wait or steal. High load with high wa and idle CPUs means tasks are stuck in D state waiting on a disk or an NFS mount, which is a very different fix from a hot loop in user code. Then ps sorted by CPU or iostat to find the process or the device.
3.The disk is 100 percent full, you deleted a 20 GB log, and df still shows 100 percent. Why, and what do you do?Medium
Deleting a file removes its name from the directory, but the inode and its blocks stay until every process that has it open closes it. Some process, usually the one writing the log, still holds the file descriptor, so the space is not freed. sudo lsof +L1 lists open files with a link count of zero and the PID holding each. The clean fix is to restart or reload that process so it closes the descriptor. If I cannot restart it, I truncate the file through the descriptor with : > /proc/PID/fd/N, which frees the blocks without a restart. In future I truncate logs instead of deleting them, and make sure logrotate is configured with copytruncate or a reload hook for that service.
4.What is the difference between kill -15 and kill -9?Easy
kill -15 sends SIGTERM, a request to terminate. The process can catch it, finish in-flight requests, flush buffers, close connections and then exit; well-written servers do exactly that. kill -9 sends SIGKILL, which the kernel enforces without ever telling the process; it cannot be caught or ignored. Open files are not flushed, locks are not released, and a database can be left needing recovery. The right order is TERM, wait a bounded time, then KILL, which is what systemd does with TimeoutStopSec and Kubernetes with terminationGracePeriodSeconds. The one process that does not die from -9 is one stuck in D state in the kernel, which is a disk or NFS problem, not a signal problem.
5.Write a systemd unit for a Node API and explain the important lines.Medium
I would put it in /etc/systemd/system/api.service with three sections. [Unit] has Description, After=network-online.target, and StartLimitIntervalSec=60 with StartLimitBurst=5 so a crash loop stops after five tries. [Service] has User=api so it never runs as root, WorkingDirectory, EnvironmentFile=/etc/api/env for config, ExecStart=/usr/bin/node /opt/api/server.js, Restart=on-failure with RestartSec=2, TimeoutStopSec=20 so SIGTERM is followed by SIGKILL after 20 seconds, MemoryMax=512M and CPUQuota=150% as cgroup limits, and LimitNOFILE=65536 because the default of 1024 file descriptors is too low for a server. [Install] has WantedBy=multi-user.target so systemctl enable works. Then daemon-reload, enable --now, and journalctl -u api -f to watch it start.
6.A process disappeared at 3 am with nothing in its own logs. Where do you look?Medium
Nothing in the app log and a sudden exit usually means the kernel killed it. I run sudo dmesg -T | grep -i -E "oom|killed process" or journalctl -k --since "3 hours ago": the OOM killer logs the victim's PID, name, RSS and oom_score. If it was OOM, I check free -h and vmstat for the pressure, find what grew with ps --sort=-rss, and look at whether the service is under a cgroup limit, since inside a container or a unit with MemoryMax the killer acts against that limit, not the whole machine. If it was not OOM, journalctl -u name shows the exit code and whether systemd restarted it, and last reboot tells me if the whole host went down. The lasting fix is a memory limit that matches reality, a negative OOMScoreAdjust for the process that must survive, and an alert on MemAvailable.
7.What are cgroups and namespaces, and how do they relate to a Kubernetes memory limit?Medium
They are the two kernel features containers are built from. A cgroup limits what a set of processes may use: CPU time, memory, I/O, number of PIDs. A namespace limits what they may see: their own PID numbering, network interfaces, mounts, hostname, user IDs. A container is an ordinary process placed in a set of namespaces and a cgroup, with a root filesystem from an image. A Kubernetes memory limit of 512Mi becomes memory.max in that container's cgroup under /sys/fs/cgroup on the node. When the container's processes exceed it, the kernel's OOM killer kills a process in that cgroup, and kubelet reports the container as OOMKilled. A CPU limit becomes cpu.max, which throttles rather than kills, which is why CPU limits show up as latency.
8.How do file permissions work, and what is setuid?Easy
Every file has an owner, a group and three sets of read, write and execute bits for owner, group and others, written as octal: 750 is rwx for the owner, r-x for the group, nothing for others. On a directory, execute means you may enter it and read means you may list it, so a directory with mode 711 lets you reach a file inside if you know its name. setuid is an extra bit on an executable that makes it run as the file's owner rather than as the caller. /usr/bin/passwd is setuid root so a normal user can update /etc/shadow through a controlled program. It is also a classic privilege escalation path, which is why NoNewPrivileges=true in a unit and allowPrivilegeEscalation: false in a pod spec exist.
9.free shows only 200 MB free on an 8 GB server. Is that a problem?Easy
Probably not. Linux uses RAM that no process needs as a page cache for file data, so a healthy server that has been up for a while always shows a small free number. The column that matters is available, which is what the kernel estimates it could give a new process after dropping cache that is cheap to drop. If available is several gigabytes, the server is fine and the cache is making reads faster. If available is near zero and vmstat shows swap in and out, that is real pressure and the OOM killer is close. So my alert is on MemAvailable below a threshold, never on MemFree.
10.What happens, step by step, when you run a command in a shell?Medium
The shell parses the line, expands variables and globs, and sets up any pipes and redirections. Then it calls fork, which creates a child process that is a copy of the shell. In the child, it applies the redirections to file descriptors 0, 1 and 2, then calls exec with the program path found in $PATH, which replaces the child's memory with the new program but keeps its PID, descriptors and environment. The parent shell calls wait and blocks until the child exits, then stores the exit code in $?. If the child never has its exit status read, it stays as a zombie until the parent does. A builtin like cd runs inside the shell without fork, which is why cd in a child script cannot change the parent's directory.
11.A service fails to start after a reboot but starts fine by hand. What do you check?Hard
By hand means with my environment, my user and the network already up; at boot none of that is guaranteed. First systemctl status and journalctl -u name -b for the exact error. Common causes: the unit is not enabled, so it never started; it started before the network or a mounted disk was ready, which After=network-online.target plus Wants= or RequiresMountsFor= fixes; it depended on an environment variable from my shell that EnvironmentFile= does not set; it ran as a different user with no permission on a directory; it hit StartLimitBurst because a dependency was slow, so systemctl reset-failed and a longer RestartSec help; or the binary lives on a filesystem in /etc/fstab that was not mounted. I would reproduce with systemctl start right after daemon-reload, then confirm with a real reboot.
12.How would you find what is using disk space on a server you have never seen?Easy
df -h first to see which filesystem is full, and df -i to rule out inode exhaustion. Then sudo du -xsh /var/* /home/* /opt/* 2>/dev/null | sort -h | tail to find the big directory, staying on one filesystem with -x. Drill in with the same command until I reach the files. The usual suspects are /var/log with an unrotated log, /var/lib/docker or /var/lib/containerd with old images, a database directory, and /tmp or a cache. Before deleting anything I run lsof +L1 to see whether space is held by deleted-but-open files, and ncdu if it is installed. Then I fix the cause: logrotate, image pruning, a retention policy, and a disk usage alert at 80 percent.
Quiz
1.A server has 8 CPUs and `uptime` shows a load average of 6.0, 6.2, 6.1. What is true?
2.You deleted a 20 GB file and `df` still reports the space as used. What is the most likely reason?
3.Which signal can a process not catch or ignore?
4.In a systemd unit, what does `Restart=on-failure` do?
5.Which value should a memory alert be based on?
6.What makes a Kubernetes container's memory limit take effect on the node?
Practice these problems
Further reading
My notes
Your notes
Autosaves to this browser.