GPU and ML infrastructure - serving models on Kubernetes
Platform teams now run GPU workloads, mostly large language model (LLM) inference, on the same Kubernetes clusters as everything else. This lesson covers GPU nodes on EKS, how GPUs are scheduled and shared, the serving engines (vLLM, Ray Serve, KServe), the metrics that matter for LLM serving and how to autoscale on them, model storage, GPU observability, the gateway in front of it all, and the basics of MLOps.
Why it matters
A GPU hour costs ten to fifty times a CPU hour, so the engineer who keeps GPUs busy saves more money than any other cost work on the platform. Job posts for platform and infrastructure roles increasingly list vLLM, Ray, KServe or "LLM inference" next to Kubernetes, and the interview questions follow: how do you schedule a GPU, why does an LLM server scale differently from a web server, what do you autoscale on, where do the model weights live. A typical platform job of this kind builds exactly this: an OpenAI-compatible gateway and a Go orchestrator in front of a fleet of GPU nodes. This lesson gives you the vocabulary and the numbers for that conversation.
Read first: Kubernetes in production - resources, autoscaling, RBAC, upgrades, EKS, Observability - Prometheus, Grafana, OpenTelemetry, logs and alerting, Scaling and resilience - caching, queues, rate limiting, DDoS, DR
Lesson
GPU nodes on EKS
A GPU is a device on the node, and Kubernetes only knows about it when a device plugin reports it to the kubelet. On EKS the pieces are:
GPU nodes carry a taint so ordinary pods do not land on a machine that costs twenty times more than they need.
apiVersion: karpenter.sh/v1
kind: NodePool
metadata:
  name: gpu-inference
spec:
  template:
    spec:
      nodeClassRef:
        group: karpenter.k8s.aws
        kind: EC2NodeClass
        name: gpu-al2023            # the accelerated AMI family is chosen in the EC2NodeClass
      taints:
        - key: nvidia.com/gpu        # only pods that tolerate this taint schedule here
          effect: NoSchedule
      requirements:
        - key: karpenter.k8s.aws/instance-family
          operator: In
          values: ["g6", "g6e"]
        - key: karpenter.sh/capacity-type
          operator: In
          values: ["on-demand"]      # spot GPUs are cheaper but get reclaimed mid-request
  limits:
    nvidia.com/gpu: 16               # a hard cap on the money this pool can spend
Scheduling a GPU
A pod asks for a GPU as an extended resource. Kubernetes rules: GPUs go in limits; if you also set requests it must equal the limit; you cannot set requests alone; and the count is an integer, so a plain nvidia.com/gpu: 1 gives that container the whole device.
resources:
  limits:
    nvidia.com/gpu: 1
    memory: 24Gi
  requests:
    cpu: "4"
    memory: 24Gi
tolerations:
  - key: nvidia.com/gpu
    operator: Exists
    effect: NoSchedule
One pod per GPU is the common case for LLM serving, because the model fills the GPU memory. Two ways to share a GPU when models are small:
- MIG (Multi-Instance GPU) partitions a supported GPU (Ampere and newer: A100, H100) into up to seven isolated instances, each with its own memory and compute, exposed as resources such as
nvidia.com/mig-1g.10gb. Fault and memory isolation are real. - Time-slicing tells the device plugin to advertise one GPU as N replicas (
sharing.timeSlicing.resources[].replicasin the plugin ConfigMap). Pods take turns on the whole GPU. There is no memory or fault isolation, so one pod's out-of-memory can take down the others, and DCGM cannot attribute metrics per container. Fine for notebooks, wrong for production serving.
The cost shape
A GPU instance is priced by the hour whether the GPU is computing or not. The main waste in every GPU platform is the idle GPU: a model loaded and waiting, a node kept warm "in case", a replica that handles ten requests a minute. The second waste is a GPU that is busy but inefficient, running batch size 1 when it could run 64. So the two numbers to put on a dashboard first are GPU utilisation (from DCGM) and tokens per second per GPU (from the serving engine). Everything else in this lesson serves those two.
Serving engines
# A single vLLM replica, the unit everything else scales.
# --max-model-len caps the KV-cache per sequence: longer contexts cost memory.
# --gpu-memory-utilization is the share of GPU memory vLLM may use for weights plus KV-cache.
vllm serve meta-llama/Llama-3.1-8B-Instruct \
  --dtype auto \
  --max-model-len 4096 \
  --gpu-memory-utilization 0.90 \
  --api-key "$VLLM_API_KEY"
curl -s localhost:8000/metrics | grep -E 'vllm:num_requests_(running|waiting)|vllm:kv_cache_usage_perc'
Why GPU serving scales differently, and what to scale on
A web server handles one request per thread and its cost grows with request count. An LLM server generates tokens in steps: every step reads the whole model's weights from GPU memory once and advances every active sequence by one token. The step costs nearly the same whether 1 or 64 sequences are active, so the engine wants a large batch. Continuous batching admits new requests into the running batch at any step instead of waiting for the batch to finish, and the limit on batch size is KV-cache memory: every active token of every active sequence keeps its attention keys and values on the GPU. That is why the metrics that matter are not CPU or requests per second.
Autoscale on queue depth or KV-cache usage, not on CPU. KEDA's Prometheus scaler does it in a few lines; the HPA with a custom metrics adapter is the alternative.
apiVersion: keda.sh/v1alpha1
kind: ScaledObject
metadata:
  name: llama-8b
spec:
  scaleTargetRef:
    name: llama-8b                   # the vLLM Deployment
  minReplicaCount: 1                 # 0 is possible but the first request then waits a cold start
  maxReplicaCount: 8
  advanced:
    horizontalPodAutoscalerConfig:
      behavior:
        scaleDown:
          stabilizationWindowSeconds: 600   # a replica takes minutes to load, so do not flap
  triggers:
    - type: prometheus
      metadata:
        serverAddress: https://prometheus.monitoring.svc:9090   # or the plain in-cluster URL
        query: sum(vllm:num_requests_waiting{deployment="llama-8b"})
        threshold: "8"               # add a replica for every 8 waiting requests
Two things make this slower than web autoscaling: a new GPU node takes minutes to appear, and a new replica then loads tens of gigabytes of weights. Scale early and scale down late.
Model loading, image size and storage
Model weights should not live in the container image. An 8B-parameter model in 16-bit weights is about 16 GB; baking it into the image makes every pull slow, every image rebuild copy it again, and every registry bill grow. The pattern is a small image with the engine, and weights fetched at startup from S3, cached on the node (an init container or a hostPath cache, or a PVC on a fast disk) so the second replica on that node does not download again. For fleets that all need the same weights, Amazon FSx for Lustre linked to the bucket gives a shared, fast file system. A readiness probe on the engine's health endpoint keeps traffic away until the model is loaded, and a long initialDelaySeconds or a startup probe stops the kubelet from killing a pod that is still loading.
The gateway and the fleet
User traffic should never hit a vLLM pod directly. An OpenAI-compatible gateway sits in front and owns everything that is not inference: API keys and JWT verification, per-model routing (one path, many backends), quotas (requests per minute, tokens per day, concurrent streams per key), token metering for billing, request and response size limits, and streaming of the response back to the client as it is generated. Concurrency limits matter more than rate limits here: ten streams of 2,000 tokens each hold a GPU for far longer than ten short requests.
For a fleet that is not all in one cluster, a pattern worth knowing: GPU nodes behind NAT (a lab, a partner's data centre, a cheaper provider) open an outbound WebSocket to a control plane and keep it open. The orchestrator sends work down that socket, streams tokens back up it, receives heartbeats and model-load status, and marks a node unhealthy when heartbeats stop. No inbound port on the GPU node is ever exposed. Multiple orchestrator instances share state through Redis. The failure modes to design for: reconnect storms when the control plane restarts, heartbeats written to the database on every beat, requests routed to a node that stopped answering, and goroutine leaks when a client disconnects mid-stream.
MLOps in a paragraph
Serving is the end of a pipeline. Upstream, experiment tracking (MLflow is the common open source choice) records every training run's parameters and metrics; a model registry (also in MLflow) versions the resulting artifacts and marks which one is in production; pipelines (Kubeflow Pipelines, Argo Workflows, or plain CI jobs) make training reproducible; and data versioning (DVC, LakeFS) pins the data a model was trained on. The platform team's part is the same as for any software: the registry is the source of truth, a deploy is a change of the model version in Git, and a rollback is a revert. The awesome-mlops and LMOps lists under resources go deeper.
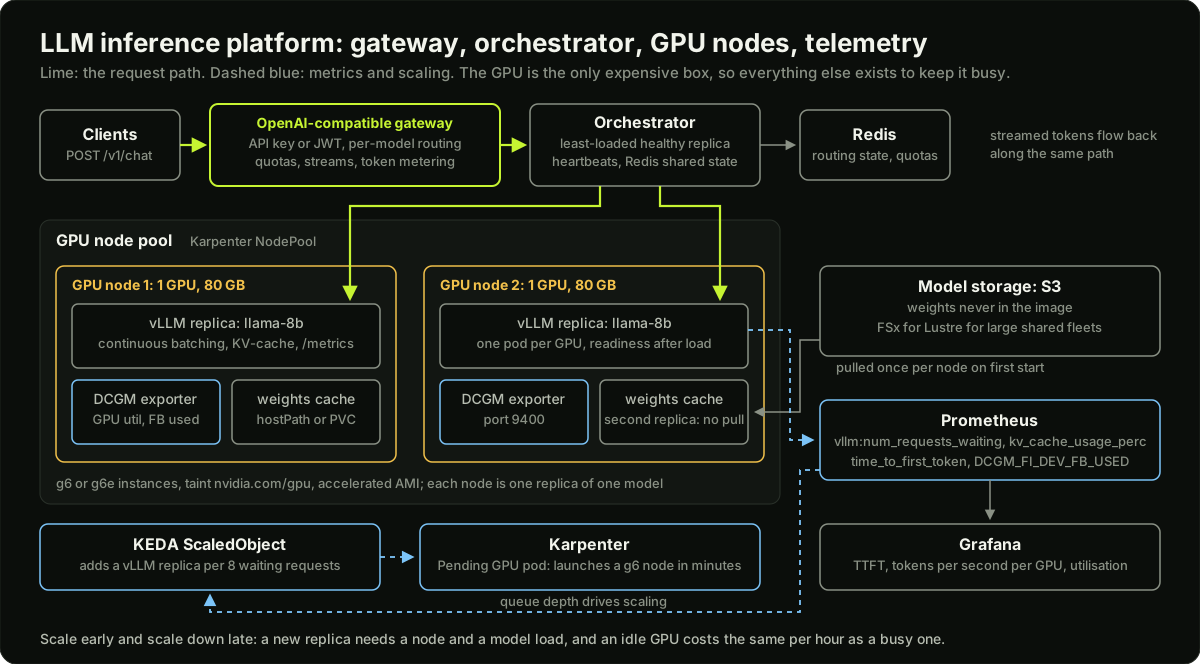 An LLM inference platform: an OpenAI-compatible gateway in front of an orchestrator, GPU nodes running vLLM, model storage in S3 with a node cache, and telemetry from DCGM and vLLM into Prometheus
Diagram
Worked example
Capacity for an LLM serving platform. Every number below is an assumption chosen to make the arithmetic visible; measure your own model on your own GPU before you size anything.
Assume an 8B-parameter model in 16-bit weights, so about 16 GB of weights, on a GPU with 80 GB of memory. Assume the engine reserves 4 GB for working memory, so 80 - 16 - 4 = 60 GB is left for the KV-cache. Assume the model has 32 layers, 8 key-value heads of dimension 128, and 2 bytes per value: KV per token = 2 (keys and values) x 32 x 8 x 128 x 2 bytes = 131,072 bytes = 128 KiB. With a maximum context of 4,096 tokens, one sequence can need 4,096 x 128 KiB = 512 MiB, so 60 GiB / 512 MiB = 120 concurrent sequences fit on one GPU at full context.
Target: 200 concurrent streams, each reading at 20 tokens per second, so the fleet must generate 200 x 20 = 4,000 output tokens per second. Assume that one GPU, at a batch of around 100 sequences, generates 2,500 output tokens per second in aggregate (a measured figure in real life). By throughput: 4,000 / 2,500 = 1.6 GPUs. By memory: 200 / 120 = 1.67 GPUs. Add 30 percent headroom for bursts and for one replica being down while it reloads: 1.6 x 1.3 = 2.08 and 1.67 x 1.3 = 2.17, so 3 GPUs, one vLLM replica each, with KEDA allowed to scale to 4.
Cost: assume 4.00 USD per GPU-hour on demand. Three GPUs cost 12 USD per hour, or 12 x 730 = 8,760 USD per month. At full load the fleet produces 4,000 x 3,600 = 14.4 million output tokens per hour, so the cost is 12 / 14.4 = 0.83 USD per 1 million output tokens. Real fleets do not run at full load: at an average 50 percent utilisation the same hardware produces 7.2 million tokens per hour and the cost doubles to 1.67 USD per 1 million tokens. That doubling is the whole business case for scale-to-fit and for batching: the GPU costs the same per hour whether it is at 50 or 100 percent, so utilisation is the price.
Two checks an interviewer will push on. Time to first token: with 100 sequences in the batch and a 1,000-token prompt, the prefill competes with 100 decode steps, so TTFT might be a second or more; if the product needs under 500 ms, you keep the batch smaller and buy more GPUs. And the cold start: a new replica pulls 16 GB of weights; from an S3 cache on the node at an assumed 1 GB per second that is 16 seconds plus load time, from S3 over the network at 200 MB per second it is 80 seconds, which is why the weights are cached and why the scaler acts on queue depth early.
Runnable code
"""Continuous batching versus one-at-a-time serving, as a tiny discrete simulation.

The GPU model: one decode step produces one token for every active sequence and costs
STEP_BASE_MS (reading the weights) plus STEP_PER_SEQ_MS per active sequence. That is
the whole reason batching works: the expensive part of a step is paid once, not per
request. Prefill (the prompt) costs PREFILL_MS_PER_TOKEN per prompt token, paid once.

Two schedulers run the same 50 requests:
  - serial: one request at a time, batch size 1 (a naive web-style server)
  - continuous: admit waiting requests into the running batch at any step, up to MAX_BATCH
Printed: mean and p95 latency, tokens per second, GPU busy share, mean batch size.
"""
import random

STEP_BASE_MS = 20.0        # cost of one decode step with one sequence (weight reads)
STEP_PER_SEQ_MS = 0.5      # extra cost per additional active sequence
PREFILL_MS_PER_TOKEN = 0.05
MAX_BATCH = 32
N_REQUESTS = 50


def make_requests(seed=7):
    rng = random.Random(seed)
    reqs = []
    t = 0.0
    for i in range(N_REQUESTS):
        t += rng.expovariate(1 / 40.0)            # arrivals about 40 ms apart on average
        reqs.append({"id": i, "arrival": t,
                     "prompt": rng.randint(50, 800),
                     "output": rng.randint(20, 300)})
    return reqs


def step_cost(batch_size):
    return STEP_BASE_MS + STEP_PER_SEQ_MS * batch_size


def serial(reqs):
    """Batch size 1: each request owns the GPU until it is done."""
    clock, busy, latencies, tokens, batches = 0.0, 0.0, [], 0, []
    for r in reqs:
        clock = max(clock, r["arrival"])
        work = r["prompt"] * PREFILL_MS_PER_TOKEN + r["output"] * step_cost(1)
        clock += work
        busy += work
        latencies.append(clock - r["arrival"])
        tokens += r["output"]
        batches.extend([1] * r["output"])
    return summarize("serial, batch size 1", latencies, tokens, busy, clock, batches)


def continuous(reqs):
    """Continuous batching: every step, admit waiting requests, advance all active ones."""
    clock, busy, latencies, tokens, batches = 0.0, 0.0, [], 0, []
    waiting = sorted(reqs, key=lambda r: r["arrival"])
    active = []
    while waiting or active:
        # Admit requests that have arrived, up to the batch limit; pay their prefill now.
        while waiting and waiting[0]["arrival"] <= clock and len(active) < MAX_BATCH:
            r = waiting.pop(0)
            prefill = r["prompt"] * PREFILL_MS_PER_TOKEN
            clock += prefill
            busy += prefill
            active.append({**r, "left": r["output"]})
        if not active:                               # GPU idle until the next arrival
            clock = waiting[0]["arrival"]
            continue
        cost = step_cost(len(active))
        clock += cost
        busy += cost
        batches.append(len(active))
        for a in active:
            a["left"] -= 1
            tokens += 1
        for a in [a for a in active if a["left"] == 0]:
            latencies.append(clock - a["arrival"])
            active.remove(a)
    return summarize(f"continuous, max batch {MAX_BATCH}", latencies, tokens, busy, clock, batches)


def summarize(name, latencies, tokens, busy, makespan, batches):
    lat = sorted(latencies)
    p95 = lat[int(0.95 * (len(lat) - 1))]
    out = {
        "name": name,
        "mean_latency_s": sum(lat) / len(lat) / 1000,
        "p95_latency_s": p95 / 1000,
        "tokens_per_s": tokens / (makespan / 1000),
        "gpu_busy_share": busy / makespan,
        "mean_batch": sum(batches) / len(batches),
        "makespan_s": makespan / 1000,
    }
    print(f"{out['name']:<28} mean latency {out['mean_latency_s']:6.2f} s   p95 {out['p95_latency_s']:6.2f} s   "
          f"throughput {out['tokens_per_s']:7.1f} tok/s   busy {out['gpu_busy_share']:5.1%}   "
          f"mean batch {out['mean_batch']:5.1f}   all done at {out['makespan_s']:6.1f} s")
    return out


if __name__ == "__main__":
    reqs = make_requests()
    total_tokens = sum(r["output"] for r in reqs)
    print(f"{N_REQUESTS} requests, {total_tokens} output tokens, prompts 50 to 800 tokens\n")
    s = serial(reqs)
    c = continuous(reqs)
    print()
    print(f"throughput gain from batching: {c['tokens_per_s'] / s['tokens_per_s']:.1f}x")
    print(f"mean latency: {s['mean_latency_s']:.1f} s -> {c['mean_latency_s']:.1f} s")
    print("note: the serial GPU is 'busy' almost all the time and still slow; busy is not efficient.")
    assert c["tokens_per_s"] > 3 * s["tokens_per_s"]
    assert c["mean_latency_s"] < s["mean_latency_s"]
    assert c["mean_batch"] > 5
    print("self-checks passed: batching raised throughput over 3x and cut latency")
Key takeaways
A GPU is a device plugin resource: pods ask for
nvidia.com/gpuin limits, nodes carry a taint, and the driver and plugin come from the EKS accelerated AMI or the GPU Operator.One pod per GPU is the serving norm; MIG shares with isolation, time-slicing shares without it.
GPUs are billed by the hour whether busy or idle, so utilisation and tokens per second per GPU are the first two numbers on the dashboard.
vLLM is the engine; KServe or hand-written Deployments wrap it; Ray Serve composes models; the gateway owns keys, quotas, routing and metering.
LLM serving scales on queue depth and KV-cache usage, not CPU; KEDA with the Prometheus scaler does it, with long cooldowns because replicas take minutes to load.
Weights live in S3 with a node cache, never in the image; readiness gates traffic until the model is loaded.
Concurrency limits matter more than rate limits for streaming workloads.
Common mistakes
Baking a 16 GB model into the container image and then wondering why every scale-out takes ten minutes.
Autoscaling vLLM on CPU utilisation, which barely moves while the GPU queue grows.
Using time-slicing for production serving and discovering that one pod's OOM takes down the neighbours.
Setting a liveness probe with a short delay on a pod that needs two minutes to load weights, so it is killed in a loop.
Measuring success as "GPU utilisation is 95 percent" without tokens per second; a batch of one can also keep a GPU busy.
Exposing a vLLM pod straight to the internet with no gateway, so there are no quotas, no metering and no abuse controls.
Practice
Without a GPU: run the simulation from this lesson, then change MAX_BATCH to 4 and to 128 and record how throughput and p95 latency move. Write two sentences on why p95 can get worse as batch size grows.
On a kind cluster, deploy a small CPU-only vLLM or any OpenAI-compatible mock server, scrape its
/metricswith Prometheus, and write a KEDA ScaledObject that scales it on a queue-depth metric. Generate load with a script that opens 50 concurrent streams and confirm the replica count changes.Write a 60-line Go or Python gateway that fronts the mock server, enforces 5 concurrent streams per API key, counts prompt and output tokens per key, and exposes both as Prometheus metrics. Show that the sixth stream gets a 429.
On a free-tier AWS account (no GPU needed), write the Karpenter NodePool and EC2NodeClass for a GPU pool with a taint and an instance-family requirement, validate them with
kubectl apply --dry-run=serveragainst a real EKS control plane, and explain each field in the README.
Interview questions (7)
1.How does a pod get a GPU on EKS, end to end?Medium
The node must be a GPU instance, say g6, running an accelerated AMI with the NVIDIA driver, and it needs the NVIDIA device plugin, which the Bottlerocket NVIDIA AMI includes and AL2023 does not, or the GPU Operator installs. The plugin tells the kubelet the node has N nvidia.com/gpu. The pod puts nvidia.com/gpu: 1 under limits, tolerates the GPU taint, and the scheduler places it on a node with a free device. The container toolkit then exposes that device inside the container. If the pod stays Pending, I check kubectl describe node for the allocatable GPU count, the device plugin DaemonSet, and whether Karpenter's NodePool allows the instance family.
2.Why does an LLM server scale differently from a web server, and what do you autoscale on?Hard
A web server's cost grows with requests. An LLM server generates tokens in steps, and each step reads the whole model's weights once and advances every active sequence by one token, so a step with 64 sequences costs little more than a step with one. The engine wants a big batch, and continuous batching admits new requests into the running batch at any step. The limit is KV-cache memory, since every active token of every sequence keeps its keys and values on the GPU. So CPU tells you nothing. I scale on vllm:num_requests_waiting or KV-cache usage with KEDA's Prometheus scaler, with a long cooldown because a new replica needs a GPU node and minutes to load weights, and I watch time to first token as the user-facing signal.
3.Where should model weights live, and why not in the image?Easy
In object storage, S3, with a cache on the node, and the image holds only the engine. A 16 GB model inside an image makes every pull slow, bloats the registry and forces a rebuild to change the model. With weights in S3, the pod fetches them at startup into a hostPath or PVC cache so the next replica on that node starts fast; for a large fleet FSx for Lustre linked to the bucket gives a shared fast file system. A readiness probe on the engine's health endpoint keeps traffic away until the load finishes, and a startup probe stops the kubelet from killing it meanwhile.
4.What are MIG and time-slicing, and when would you use each?Medium
Both let several pods share one GPU. MIG partitions a supported GPU, A100 or H100 class, into up to seven hardware instances with their own memory and compute, exposed as distinct resources; a fault in one instance stays in that instance. Time-slicing is a device plugin setting that advertises one GPU as N replicas and lets pods take turns on the whole device; there is no memory or fault isolation, and DCGM cannot attribute usage per container. I would use MIG for production serving of small models where isolation matters, time-slicing for notebooks, development and batch jobs that tolerate interference, and neither for a large LLM, which needs the whole GPU.
5.What does the gateway in front of GPU serving do that the serving engine does not?Medium
The engine turns prompts into tokens. The gateway owns everything else: authentication with API keys or JWTs, per-model routing so one OpenAI-compatible endpoint fronts many backends, quotas on requests, tokens per day and concurrent streams, token metering for billing, size limits on prompts and responses, and streaming the response back as it is generated. Concurrent-stream limits matter most, because a few long generations hold a GPU far longer than many short requests. It also absorbs abuse, so that an SSRF attempt or a flood of oversized prompts never reaches a 4 dollar per hour GPU.
6.GPU utilisation is at 95 percent but users complain the service is slow. What do you look at?Hard
Busy is not efficient. First the engine metrics: vllm:num_requests_running and vllm:num_requests_waiting. If running is small and waiting is large, the batch is tiny because KV-cache is full, often because --max-model-len is high and a few long contexts hog memory; the fix is a shorter max context, prefix caching, or more replicas. If running is large, the batch is healthy and the slowness is per-request decode speed, which means the GPU is simply saturated and I scale out. Then time to first token: if it spikes on long prompts, prefill is competing with decode and I cap prompt length or add capacity. I also check that the gateway is not retrying streams.
7.Explain the WebSocket control plane pattern for GPU nodes behind NAT.Hard
When GPU nodes sit in networks you do not control, with no inbound ports, each node opens an outbound WebSocket to the orchestrator and keeps it alive. The orchestrator pushes inference requests down the socket, the node streams tokens back up it, and heartbeats carry load and model status. Node health is the heartbeat: miss a few and the node is drained from routing. Several orchestrator instances share routing state through Redis so a client can reach any of them. The traps are reconnect storms when the orchestrator restarts, which need jittered backoff; writing every heartbeat to the database, which needs batching or an in-memory view; routing to a node that stopped answering, which needs per-request timeouts; and goroutine leaks when a client disconnects mid-stream, which need context cancellation on both sides.
Quiz
1.How must a container request an NVIDIA GPU?
2.Which metric is the best autoscaling signal for a vLLM Deployment?
3.What makes continuous batching efficient on a GPU?
4.Which GPU sharing method gives memory and fault isolation between pods?
5.Why keep model weights out of the container image?
Practice these problems
Further reading
My notes
Your notes
Autosaves to this browser.