Scaling and resilience - caching, queues, rate limiting, DDoS, DR
Scaling is making a system handle more load; resilience is making it keep working when parts fail. Both come from the same layered design: stateless replicas behind a load balancer, state pushed into databases, caches, object storage and queues, limits and timeouts at every hop, and a tested plan for losing a zone or a region. This lesson covers each layer with the numbers interviewers expect: cache hit ratios, queue semantics, rate limiter algorithms, retry budgets, connection pools, RPO and RTO.
Why it matters
"How would you scale this" and "what happens if this fails" are the two questions behind every system design round, and the DevOps version is more concrete than the developer version: which layer absorbs which failure, what setting makes it do so, and what you measured. Job posts for platform roles list rate limiting, quotas, abuse controls, Redis, Aurora, Cloudflare edge and WebSocket scaling, and the 100xDevs cohort spends five weeks on queues, WebSockets, rate limiting, captchas and DDoS. The worked example on 200,000 WebSocket connections is the kind of estimate you will be asked to do on a whiteboard.
Read first: Networking for DevOps - TCP/IP, DNS, HTTP, TLS, SSH, Web servers, reverse proxies and TLS - Nginx, certificates, process managers, AWS core - IAM, VPC, EC2, S3, RDS, load balancers, autoscaling, Kubernetes in production - resources, autoscaling, RBAC, upgrades, EKS, SRE practice - SLOs, error budgets, incidents and postmortems
Lesson
Vertical and horizontal scaling, and where state goes
Vertical scaling is a bigger machine: more vCPUs, more memory. It is the first move because it needs no code change, and the last one available, because the largest instance is a hard ceiling and a single machine is a single failure. Horizontal scaling is more machines behind a load balancer. It has no ceiling but one condition: a request must be able to land on any replica, so the replica holds no state between requests. Sessions go to Redis, files to S3, work-in-progress to a queue, records to the database. An Auto Scaling group or a Kubernetes HPA can add replicas in a minute, but only if the new replica needs nothing from the old one.
Load balancing and health checks are the glue. The load balancer sends traffic only to targets that pass a health check and removes a failing replica after interval times threshold (an assumed tuning: 10 s and 3). The check must test what the service does, not just that a port is open, or a replica with a dead database connection keeps receiving traffic.
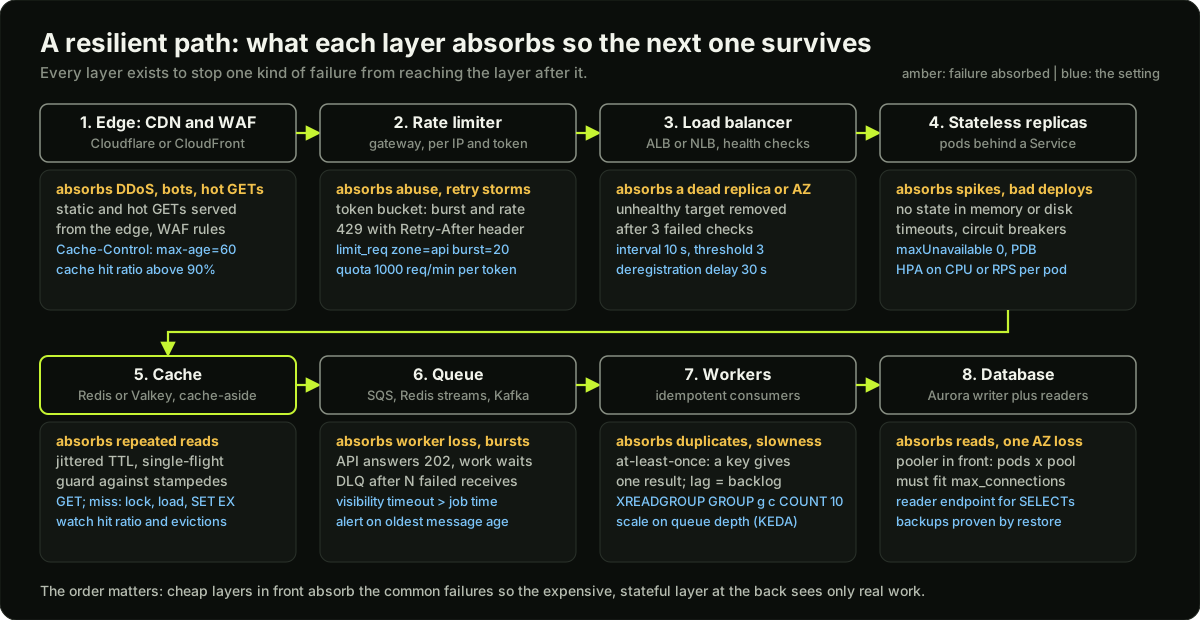 A resilient request path from edge CDN and WAF through rate limiter, load balancer, stateless replicas, cache, queue and workers to a database with replicas, with the failure each layer absorbs and the setting that makes it work
Caching
A cache answers repeated reads from memory instead of the database. Cache-aside is the pattern you will be asked about: the app checks the cache, on a miss reads the database, writes the value into the cache with a TTL (time to live), and returns it. Writes go to the database and either delete the cache key (invalidation) or overwrite it. Redis and its open-source fork Valkey are the usual in-memory stores; ElastiCache runs both on AWS. A CDN is a cache at the edge for HTTP responses: static files always, and any GET with a Cache-Control: public, max-age=60 header that is the same for every user.
Two numbers describe a cache: hit ratio and p99 latency. A 90 percent hit ratio means the database sees 10 percent of reads; raising it to 95 percent halves the database load again. The failure mode is the cache stampede: a hot key expires, 2,000 requests in the same 50 ms all miss, and all 2,000 go to the database at once. The fix is single-flight: the first miss takes a short lock (SET lock:key 1 NX EX 5), loads and fills the cache, and the others wait for the fill or serve the stale value. Add jitter to TTLs (300 + random(0, 60) seconds) so keys set together do not expire together.
Queues and async work
A queue sits between the API and the workers so the API answers in 20 ms with 202 Accepted while the real work (send the email, call the payment provider) happens later. It absorbs bursts (the queue grows, workers catch up), isolates failures (workers can be down for ten minutes and nothing is lost), and lets the two sides scale separately.
The semantics decide the design. Almost every queue gives at-least-once delivery: a worker that crashes after doing the work but before acknowledging will see the message again. So consumers must be idempotent: processing the same message twice gives the same result, usually by storing the message id with the result and skipping duplicates. Messages that fail repeatedly go to a dead-letter queue (DLQ) after N attempts so they stop blocking the others and a human can look. Backpressure is the queue telling the producer to slow down: a bounded queue, a 429 from the API when depth is above a threshold, or simply the lag metric that the autoscaler reads.
# Redis streams: the 100xDevs worker pattern in redis-cli
XGROUP CREATE jobs workers $ MKSTREAM                        # create the stream and group
XADD jobs MAXLEN ~ 100000 * type email user 42               # producer: trim to about 100k entries
XREADGROUP GROUP workers w1 COUNT 10 BLOCK 5000 STREAMS jobs >   # worker: 10 new messages, wait up to 5 s
XACK jobs workers 1699999999999-0                            # done; without this the entry stays pending
XPENDING jobs workers - + 10                                 # what is stuck, and for how long
XAUTOCLAIM jobs workers w2 60000 0-0 COUNT 10                # w2 takes over entries idle for over 60 s
Scaling WebSocket servers
An HTTP request lasts milliseconds; a WebSocket connection lasts hours and lives in one process's memory. That changes three things. First, sticky routing: the load balancer keeps a connection on the node that holds it, and the 100xDevs week 44 pattern routes by room or user id so one node holds everyone in a room. Second, fan-out across instances: when a message must reach users spread over 17 nodes, the sender publishes once to Redis pub/sub or a stream, every node subscribes, and each node delivers to the connections it holds. Third, limits per node: each connection costs a file descriptor and memory (an assumed 20 to 50 KB in Go or Node with buffers), so a node has a connection ceiling set by ulimit -n, memory and the CPU needed for ping frames; keep it at 60 percent so one node's loss fits on the others.
A deploy must drain gracefully: the pod stops accepting new connections, sends a close frame to existing ones at a limited rate, and clients reconnect with jittered backoff to the other pods. Without the rate limit and the jitter, a deploy of one pod becomes a reconnect storm that overloads the rest. Set terminationGracePeriodSeconds to cover the drain (60 to 120 seconds), use a preStop hook to flip readiness first, and use a PodDisruptionBudget so nodes drain one pod at a time.
Rate limiting, abuse controls and DDoS
Rate limiting caps how many requests a client may make, to protect the service and to make abuse expensive. Two algorithms cover the interview:
- Token bucket: a bucket of capacity B refills at R tokens per second; each request takes one token; an empty bucket means 429. It allows a burst of B and a steady rate of R. NGINX
limit_reqwithburst=20 nodelayis one; so is the AWS API Gateway throttle. Most edge limiters are token buckets. - Sliding window: count requests in the last W seconds (a log of timestamps, or two fixed windows weighted by overlap); above N, refuse. It is strict about the rate with no burst allowance, and after a burst it refuses everything until the window passes, which the code example below shows.
Apply limits at three places: at the edge per IP (Cloudflare or AWS WAF rate-based rules, the first line, cheap, catches scrapers), at the gateway per API token or user (the fair-share line, 1,000 requests per minute per token as an assumed quota), and per operation for expensive endpoints (5 password resets per hour per account). Quotas are limits over a day or a month, enforced from a counter in Redis (INCR with EXPIRE). Abuse controls beyond rate: a captcha or a managed bot score on signup and login, device and IP reputation, and a kill switch per token. The 100xDevs weeks 45 and 47 cover exactly this chain: rate limit, captcha, then DDoS.
A DDoS (distributed denial of service) sends traffic from thousands of sources, so per-IP limits do not help. Volumetric floods (tens of Gbps of UDP) can only be absorbed at the edge: an anycast CDN spreads the traffic over many points of presence and drops it there; AWS Shield Standard does this for every customer, Shield Advanced adds application-layer detection and a response team; Cloudflare does both. Application-layer floods (millions of valid-looking HTTP requests) need the WAF: managed bot rules, challenge pages, and rate rules keyed on a fingerprint rather than an IP. The rule for your own architecture: nothing with a public IP except the edge, so there is nothing else to hit.
# NGINX token bucket per client IP: 10 requests per second, bursts of 20 served without delay, then 429
limit_req_zone $binary_remote_addr zone=api:10m rate=10r/s;
limit_req_status 429;
server {
    location /api/ {
        limit_req zone=api burst=20 nodelay;
        proxy_pass https://app;
    }
}
Timeouts, retries, circuit breakers, bulkheads
Every remote call needs a timeout, both to connect and to read, set from the dependency's measured p99 plus a margin; without one, a slow dependency holds every thread and the slowness spreads. Retries recover from transient failures but are selfish: each retry is extra load on a service that is already failing. The retry storm is three layers each retrying three times, which turns one request into 27 at the bottom, and a brief blip into an outage. The rules: retry only idempotent calls, at one layer, a small number of times, with exponential backoff and jitter (wait random(0, base * 2^attempt), capped), and with a retry budget (retries may be at most 10 percent of requests). A circuit breaker counts failures per dependency: after N failures it opens and fails fast without calling, after a cooldown it goes half-open and lets one trial call through, and closes again on success. It turns a dead dependency from a timeout on every request into an instant error, and gives the dependency room to recover. Bulkheads isolate resources per dependency: a separate connection pool or goroutine limit for each, so a slow payment provider cannot consume the pool the search endpoint needs.
The Tail at Scale idea: at fan-out, latency is decided by the slowest call. If a page calls 100 backends and each has a 1 percent chance of a slow (p99) response, the page is slow 63 percent of the time (1 minus 0.99 to the power 100). That is why p99 matters more than the average for anything that fans out, and why hedged requests help: send the same request to a second replica after the p95 delay and take the first answer, which cuts the tail for a few percent of extra load.
Database scaling
The database holds the state, so it is the hardest layer to scale. In order of cost: connection pooling first. Each Postgres connection is a process with memory, and max_connections is often 100 to 500. A pool in the app (10 connections per pod) or a pooler in front (PgBouncer, RDS Proxy) keeps the count fixed. The classic incident: a deploy with maxSurge doubles the pod count for a minute, every new pod opens its 10 connections, 40 pods times 10 is 400, the limit is 300, and the new pods crash on too many connections, so the rollout stalls. Size pools so pods times pool size plus surge stays under the limit, or put RDS Proxy in front. Next, read replicas: Aurora gives a writer endpoint and a reader endpoint that balances across up to 15 replicas; the app sends SELECTs that tolerate replica lag to the reader. Then caching in front of reads, then sharding, which splits rows across databases by a key such as tenant id, moves joins across shards into the application, and is a multi-quarter project; do it when a single writer cannot keep up after the cheaper moves.
Multi-AZ, multi-region and disaster recovery
RPO (recovery point objective) is how much data you may lose, as time since the last good copy; RTO (recovery time objective) is how long until service is back. The business sets them; the design follows. Backups are the floor: automated snapshots daily with a 7 to 35 day retention, point-in-time recovery enabled, copied to another region, and restored on a schedule into a scratch account, because an untested backup is a guess. DNS failover with Route 53: a health check (request interval 30 s by default, 10 s for fast; failure threshold 3 by default) on the primary endpoint, and a failover record set that answers with the secondary when the check fails; keep the TTL at 60 s so clients move within a minute of the DNS change. The DR runbook is the list of commands, in order, with the person who runs each and the expected time, rehearsed every quarter: freeze writes, promote the secondary database, repoint DNS, scale the secondary region, verify with synthetic checks, announce.
Capacity planning and chaos testing
Plan from numbers: peak requests per second (the busiest hour of the busiest day plus growth over the planning horizon), the measured capacity of one replica at the latency target (load test one pod: say 400 requests per second at p99 under 200 ms), then replicas equals peak divided by per-replica capacity, divided by a utilisation target of 0.6 to 0.7, plus one zone's worth so losing an AZ does not drop below peak. Do the same for connections, queue depth and database IOPS. Then test the plan: chaos testing kills a pod, a node, an AZ or a dependency on purpose, with a small blast radius, and checks that the system did what the design said. Start cheap: delete a pod and confirm no errors; add 300 ms of latency to the database with Toxiproxy and confirm the breaker opens; cordon every node in one AZ and confirm the PDBs keep the service up.
Diagram
Worked example
A WebSocket service with 200,000 concurrent connections.
Step 1, connections per node. One Go pod handles an assumed 20,000 connections comfortably: at 40 KB per connection that is 800 MB of memory, plus ping frames every 30 s, which is 20,000 / 30 = 667 small writes per second, trivial CPU. Set the file descriptor limit above 25,000.
Step 2, nodes needed with headroom. The bare minimum is 200,000 / 20,000 = 10 pods. Run at 60 percent utilisation so a lost AZ (one third of pods) or a deploy surge fits: 200,000 / (20,000 x 0.6) = 16.7, so 17 pods, about 11,765 connections each. Spread over 3 AZs with a topology spread constraint; losing one AZ leaves 12 pods holding 16,667 each, under the 20,000 ceiling.
Step 3, fan-out for a message to 10 percent of users. 20,000 recipients, 1 KB payload. The publisher writes once to Redis pub/sub; Redis sends one copy to each of the 17 subscribed pods: 17 KB out of Redis. Each pod delivers to its own share, 20,000 / 17 = 1,176 connections, 1.2 MB of client egress per pod. At 50 such messages per second, Redis egress is 50 x 17 KB = 850 KB/s, under 1 MB/s, and client egress across the fleet is 50 x 20,000 x 1 KB = 1,024 MB/s, which is 8.2 Gbit/s, about 0.48 Gbit/s per pod: the client side, not Redis, is the bandwidth cost, and node network capacity is what you size.
Step 4, drain time on a deploy. A pod holds 11,765 connections. Closing them all at once makes 11,765 clients reconnect in the same second. Instead the pod closes 500 per second: 11,765 / 500 = 23.5 seconds to drain. Clients reconnect with a random 0 to 30 s delay, so the reconnect rate on the other pods is about 11,765 / 30 = 392 per second, which a fleet of 16 pods absorbs. With maxSurge: 25% (25 percent of 17 is 4.25, rounded up to 5) the rollout replaces about 5 pods per wave: ceil(17 / 5) = 4 waves, each 24 s of drain plus about 30 s for the new pod to be Ready, about 216 seconds, 3.6 minutes for the full rollout. terminationGracePeriodSeconds must be at least 24 s plus margin; set 60.
Runnable code
"""Two rate limiters on the same burst, then a circuit breaker on a flaky dependency.

Part 1: a token bucket (capacity 10, refill 5 per second) and a sliding window
log (10 requests per 2 seconds) see the same 60-request timeline: a burst of
30 at t=0, then 30 spread evenly over the next 6 seconds. Both allow the same
long-run rate (5 per second) but treat the burst differently.

Part 2: a circuit breaker (closed, open, half-open) sits in front of a fake
dependency that is down from t=5 s to t=22 s. We count how many calls the
breaker refused instead of sending them into a dead service.
"""
from collections import deque


class TokenBucket:
    def __init__(self, capacity, refill_per_s):
        self.capacity = capacity
        self.refill = refill_per_s
        self.tokens = float(capacity)
        self.last = 0.0

    def allow(self, now):
        self.tokens = min(self.capacity, self.tokens + (now - self.last) * self.refill)
        self.last = now
        if self.tokens >= 1:
            self.tokens -= 1
            return True
        return False


class SlidingWindowLog:
    def __init__(self, limit, window_s):
        self.limit = limit
        self.window = window_s
        self.log = deque()  # timestamps of allowed requests

    def allow(self, now):
        while self.log and self.log[0] <= now - self.window:
            self.log.popleft()
        if len(self.log) < self.limit:
            self.log.append(now)
            return True
        return False


def request_timeline():
    """30 requests at t=0 (a burst), then 30 requests spread over 6 seconds."""
    return [0.0] * 30 + [0.2 * i for i in range(1, 31)]


class CircuitBreaker:
    """closed: calls pass. open: calls are refused for cooldown seconds.
    half-open: one trial call decides whether to close again or reopen."""

    def __init__(self, failure_threshold=3, cooldown_s=5.0):
        self.state = "closed"
        self.failures = 0
        self.threshold = failure_threshold
        self.cooldown = cooldown_s
        self.opened_at = None
        self.transitions = []
        self.saved = 0  # calls we refused instead of sending to a broken dependency

    def _go(self, state, now):
        self.transitions.append((now, self.state, state))
        self.state = state

    def call(self, fn, now):
        if self.state == "open":
            if now - self.opened_at >= self.cooldown:
                self._go("half-open", now)
            else:
                self.saved += 1
                return "refused"
        try:
            fn(now)
        except RuntimeError:
            self.failures += 1
            if self.state == "half-open" or self.failures >= self.threshold:
                self.opened_at = now
                self._go("open", now)
            return "failed"
        self.failures = 0
        if self.state == "half-open":
            self._go("closed", now)
        return "ok"


def flaky_dependency_factory(down_from=5.0, down_until=22.0):
    calls = {"n": 0}

    def dep(now):
        calls["n"] += 1
        if down_from <= now < down_until:  # every call in this window fails
            raise RuntimeError("503 from dependency")
    return dep, calls


if __name__ == "__main__":
    timeline = request_timeline()
    bucket = TokenBucket(capacity=10, refill_per_s=5)
    window = SlidingWindowLog(limit=10, window_s=2)
    tb = [bucket.allow(t) for t in timeline]
    sw = [window.allow(t) for t in timeline]

    print("Part 1: same 60 requests, two limiters (both allow 5 per second on average)")
    print(f"  burst of 30 at t=0:     token bucket allowed {sum(tb[:30])}, sliding window allowed {sum(sw[:30])}")
    print(f"  30 spread over 6 s:     token bucket allowed {sum(tb[30:])}, sliding window allowed {sum(sw[30:])}")
    print(f"  total allowed:          token bucket {sum(tb)}, sliding window {sum(sw)}")
    assert sum(tb[:30]) == 10 and sum(sw[:30]) == 10
    # After the burst the bucket refills 1 token per 0.2 s, exactly the arrival rate: every
    # later request passes. The window stays full until t=2 (9 requests at 0.2 .. 1.8 s are
    # refused) and then admits 5 per second: 21 of the 30 pass.
    assert sum(tb[30:]) == 30
    assert sum(sw[30:]) == 21
    print("  the window refuses everything for 2 s after a burst; the bucket recovers smoothly")

    print("\nPart 2: circuit breaker in front of a dependency that is down from t=5 s to t=22 s")
    dep, calls = flaky_dependency_factory()
    cb = CircuitBreaker(failure_threshold=3, cooldown_s=5.0)
    results = []
    now = 0.0
    for i in range(80):  # 40 s of traffic
        now += 0.5  # one client call every 500 ms
        results.append(cb.call(dep, now))
    for t, old, new in cb.transitions:
        print(f"  t={t:5.1f}s  {old:>9} -> {new}")
    print(f"  calls attempted by client: {len(results)}")
    print(f"  calls that reached the dependency: {calls['n']}")
    print(f"  calls refused by the open breaker (saved): {cb.saved}")
    print(f"  final state: {cb.state}")
    assert cb.state == "closed"
    assert cb.saved > 0 and calls["n"] + cb.saved == len(results)
    assert [s for _, _, s in cb.transitions][:3] == ["open", "half-open", "open"]
    print("  self-checks passed: breaker opened on the 3rd failure, probed every 5 s, closed when the dependency recovered")
Key takeaways
Horizontal scaling needs stateless replicas; state goes to the database, Redis, S3 and a queue, and the health check must test real work.
Cache-aside with TTLs and delete-on-write; single-flight and jittered TTLs stop stampedes; hit ratio and p99 are the two numbers.
Queues give at-least-once delivery, so consumers are idempotent, failures go to a DLQ, and the visibility timeout exceeds the job time.
WebSockets scale by routing connections to a node, fanning out through pub/sub, capping connections per node at about 60 percent, and draining at a limited rate with jittered client reconnects.
Token bucket allows bursts and recovers smoothly; sliding window is strict; apply limits at the edge per IP, at the gateway per token, and per expensive operation; DDoS is absorbed only at the edge.
Timeouts on every call, retries only idempotent and only at one layer with backoff and jitter, circuit breakers to fail fast, bulkheads to isolate pools; p99 decides fan-out latency.
Pool connections so pods times pool plus deploy surge stays under max_connections; then read replicas, then cache, then shard.
Multi-AZ is the default; multi-region is a business decision expressed as RPO and RTO; backups count only when restored on a schedule; the DR runbook is rehearsed.
Common mistakes
Retrying at every layer with no backoff, which multiplies a blip into a retry storm.
A health check that only opens a TCP port, so a replica with a dead database connection keeps receiving traffic.
Updating a cache value on write instead of deleting it, and losing the race with a concurrent read that writes the old value back.
Sizing a connection pool per pod without counting the deploy surge, so every rollout hits max_connections.
A per-IP rate limit as the only DDoS defence; floods come from thousands of IPs and must be dropped at the edge.
Backups that have never been restored, and a DR plan that exists only as a diagram.
Practice
Run Redis in Docker, implement cache-aside for a slow function in Python with a 10 s TTL, hit it with 200 parallel requests at the moment the key expires, count database calls, then add a SET NX single-flight lock and count again; the second number should be 1.
Create a Redis stream and consumer group, run two workers that crash randomly after processing but before XACK, prove duplicates with a counter, then add an idempotency set keyed by entry id and prove the count is exact. Use XPENDING and XAUTOCLAIM to recover a killed worker's entries.
Put the NGINX
limit_reqblock from this lesson in front of a local app, send 100 requests in one second with a load tool, and record how many return 429 atrate=10r/s burst=20; then change toburst=0and compare.On kind, deploy a 3-replica app with a PodDisruptionBudget of minAvailable 2 and a preStop sleep, run a load test, drain a node, and confirm zero failed requests; then remove the PDB and the preStop hook and measure the difference.
Interview questions (10)
1.How would you scale a web API from one server to handle ten times the traffic?Easy
First measure: requests per second at peak, p99 latency, and what one server can do before latency breaks. Then make the API stateless: sessions to Redis, uploads to S3, long jobs to a queue, so any replica can take any request. Put replicas behind a load balancer with a health check that exercises real work, and autoscale on CPU or requests per replica with a 60 to 70 percent target. Add a cache for repeated reads and a CDN for static and cacheable responses. Then look at the database, which is now the bottleneck: pool connections, move reads to replicas, and only consider sharding after that. At every step, the number that proves it worked is p99 at the new peak.
2.What is a cache stampede and how do you prevent it?Medium
A hot key expires, and in the next few milliseconds hundreds of requests all miss the cache and all go to the database for the same value, which can take the database down at exactly the moment it is most needed. Prevention is single-flight: the first request that misses takes a short lock in Redis with SET NX and a few seconds of expiry, loads the value and fills the cache, and the other requests either wait briefly or serve the previous value if we keep a stale copy. Jittered TTLs stop many keys expiring in the same second, and refreshing hot keys in the background before they expire removes the miss entirely.
3.Why put a queue between an API and its workers, and what changes in the worker code?Medium
The queue lets the API respond in milliseconds with 202 Accepted while slow work happens later, absorbs bursts because the queue grows while workers catch up, and isolates failures because workers can be down without losing requests. It also lets the two sides scale on different signals: API on request rate, workers on queue depth. The worker code changes because delivery is at-least-once: a crash after the work but before the acknowledgement redelivers the message, so the worker must be idempotent, usually by recording the message id with the result and skipping repeats. It must acknowledge only after success, give up to a dead-letter queue after a few attempts, and finish within the visibility timeout or extend it.
4.Compare the token bucket and sliding window algorithms. Which do you use at the edge?Medium
A token bucket has a capacity and a refill rate; a request spends a token, so it allows a burst up to the capacity and then a steady rate, and it recovers smoothly because tokens keep arriving. A sliding window counts requests in the last N seconds and refuses above a limit; it is strict with no burst allowance, and after a burst it refuses everything until the window slides past, which feels harsh to clients. At the edge I use a token bucket per IP because real traffic is bursty and a page load is a burst of a dozen requests. Sliding windows fit quotas, such as 1,000 requests per minute per API token, where fairness over the window matters more than burst tolerance.
5.A dependency is slow and your whole service goes down with it. What do you add?Medium
Three things. Timeouts on every call to it, connect and read, set from its measured p99 plus margin, so a slow call cannot hold a thread forever. A circuit breaker that counts failures and opens after a threshold, so calls fail fast for a cooldown instead of waiting for the timeout, then half-opens to test recovery with a single call. A bulkhead, meaning a separate connection pool or concurrency limit for that dependency, so it cannot consume the resources other endpoints need. On top, retries only for idempotent calls, only at one layer, with exponential backoff and jitter and a retry budget, because retries against a struggling dependency are what turn slowness into an outage.
6.How does a deploy exhaust database connections, and how do you prevent it?Medium
Each pod opens a pool of, say, 10 connections at start. With 30 pods that is 300, right at a max_connections of 300. A rolling update with maxSurge 25 percent starts 8 new pods before the old ones stop, so 38 pods try to hold 380 connections, the new ones fail with too many connections, never become Ready, and the rollout stalls or flaps. Prevention: size pools so pods times pool size plus the surge stays under the limit with margin; put a pooler such as RDS Proxy or PgBouncer in front so thousands of client connections share a fixed set of server connections; and alert on connection count as a percentage of the limit so you see it at 80 percent, not at 100.
7.Explain RPO and RTO and how they change the design.Easy
RPO, recovery point objective, is how much data the business accepts losing, measured as time since the last copy: an RPO of one hour means hourly backups are enough; an RPO of seconds means continuous replication. RTO, recovery time objective, is how long the service may be down: hours allows restoring from a backup into fresh infrastructure; minutes needs a warm standby with replication and DNS failover; near zero needs active-active in two regions. Each step down in RPO and RTO roughly doubles cost and complexity, so I ask the business for the numbers first and design the cheapest architecture that meets them, then prove it with a rehearsed restore and failover.
8.How do you scale a WebSocket service, and what makes a deploy dangerous?Hard
Connections are long-lived and live in one process, so three things differ from HTTP. Routing: the load balancer keeps a connection on its node, and we route by room or user so related connections share a node. Fan-out: a message for users across many nodes is published once to Redis pub/sub or a stream, every node subscribes, and each delivers to its own connections. Limits: each connection costs a file descriptor and tens of kilobytes, so each node has a ceiling and we run at about 60 percent so losing an AZ fits. A deploy is dangerous because draining a pod disconnects thousands of clients at once, and if they all reconnect immediately the remaining pods get a storm. So the pod flips readiness, closes connections at a limited rate within a long grace period, clients reconnect with jittered backoff, and a PodDisruptionBudget keeps node drains to one pod at a time.
9.What is the Tail at Scale argument and what do you do about it?Hard
When a request fans out to many backends, its latency is the slowest of them. If each of 100 backends is slow one percent of the time, the fan-out request is slow 63 percent of the time, because the chance that all 100 are fast is 0.99 to the power 100. So the average latency of a backend tells you nothing; p99 does. The responses are to reduce variance at the source (avoid garbage collection pauses, background jobs and head-of-line blocking), and to tolerate it: hedged requests send the same call to a second replica after the p95 delay and take the first answer, costing a few percent extra load; tied requests cancel the loser; and fan-out can return partial results after a deadline rather than wait for the slowest shard.
10.How would you protect an API from a DDoS attack?Medium
Volumetric floods can only be absorbed before they reach me, so the only public entry is an anycast edge, Cloudflare or CloudFront with AWS Shield, which spreads the traffic over many locations and drops it there; the origin accepts traffic only from the edge's IP ranges. For application-layer floods, the WAF applies managed bot rules, challenges suspicious clients, and rate-based rules keyed on more than the IP. Behind that, a token bucket per IP and per token at the gateway, quotas per customer, and a captcha on signup and login. Inside, autoscaling with a ceiling and a budget alarm so the attack does not become a bill, and a kill switch to shed expensive endpoints first. The measure of success is origin request rate during the attack staying flat.
Quiz
1.A worker crashes after charging a card but before acknowledging the queue message. What property of the queue causes a problem, and what fixes it?
2.A token bucket has capacity 10 and refills 5 tokens per second. A client sends 30 requests at once and then 5 per second. What happens?
3.Which setting most directly prevents a rolling update from exhausting database connections?
4.What does a circuit breaker in the half-open state do?
5.An active-passive multi-region design with Aurora Global Database and Route 53 failover has which typical RPO and RTO?
Practice these problems
- DESIGNMulti-region disaster recovery with RPO 5 minutes and RTO 30 minutesHard
- DESIGNAutoscaling for a web app: ASG, HPA and cluster autoscalingMedium
- DESIGNRate limiting, bot and DDoS protection at the edgeMedium
- DESIGNBackup and restore for stateful workloads on KubernetesMedium
- DESIGNUptime monitoring service with global probes and alertingMedium
- OPSDatabase connections exhausted after a deployMedium
Further reading
My notes
Your notes
Autosaves to this browser.