Observability - Prometheus, Grafana, OpenTelemetry, logs and alerting
Observability is how you find out what a running system is doing from the outside: metrics (numbers over time), logs (events), and traces (one request's path across services). This lesson covers the Prometheus data model and the PromQL queries every on-call engineer writes, Alertmanager, Grafana dashboards, log shipping to Loki, distributed tracing with OpenTelemetry, the collector pipeline, and the arithmetic of what all of this costs.
Why it matters
Every SRE and platform interview has a monitoring round. The questions are specific: "write the PromQL for p95 latency", "why does rate() need a window longer than the scrape interval", "why is user_id a bad label", "how would you find which of six services made this request slow". In the job, the Prometheus and Grafana stack (100xDevs weeks 31 and 32) is what you look at during every incident, and OpenTelemetry is the standard every new service is instrumented with. Knowing the queries cold is the difference between a 5 minute and a 50 minute outage.
Read first: Kubernetes architecture and core objects, Kubernetes in production - resources, autoscaling, RBAC, upgrades, EKS, Python and Go for automation and tooling
Lesson
Monitoring versus observability
Monitoring asks questions you wrote in advance: is CPU above 80 percent, is the health check passing. Observability lets you answer questions you did not plan for, from data the system already emits: "why are only checkout requests from the Android app slow since 14:10". That needs context (labels, trace ids) you can slice later.
Three signals do the work. Metrics are numbers sampled over time: cheap, aggregated, the basis of alerting. Logs are timestamped events with detail. Traces follow one request across services and show where the time went. A fourth, profiling (which function burns CPU), is an OpenTelemetry signal still in development.
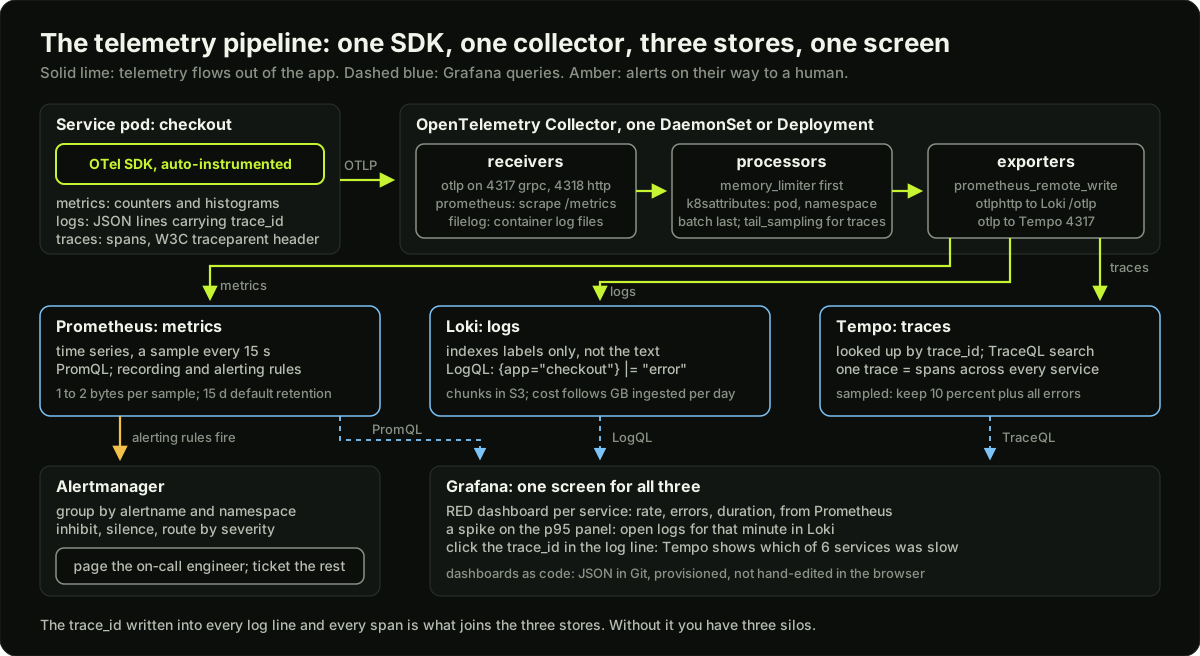 Telemetry pipeline from an app with the OpenTelemetry SDK through a collector to Prometheus, Loki and Tempo, with Grafana querying all three and Alertmanager paging on-call
The Prometheus model
Prometheus pulls. Every scrape_interval (default 1m; most clusters set 15s or 30s) it sends an HTTP GET to each target's /metrics path and stores the result with a timestamp. A target that does not answer within scrape_timeout (default 10s) gets up = 0, the first alert to write.
Targets come from service discovery: on Kubernetes, kubernetes_sd_configs lists pods, services or endpointslices from the API server. In practice you install the Prometheus Operator (the kube-prometheus-stack chart) and declare targets with a ServiceMonitor:
apiVersion: monitoring.coreos.com/v1
kind: ServiceMonitor
metadata:
  name: checkout
  namespace: shop
  labels:
    release: kube-prometheus-stack   # must match the Prometheus CR's serviceMonitorSelector
spec:
  selector:
    matchLabels:
      app: checkout                  # selects the Service, not the pods
  endpoints:
    - port: http                     # the Service's named port
      interval: 15s
The Operator watches ServiceMonitors (and PodMonitors, which select pods directly), generates the scrape config and reloads Prometheus. The classic mistake is a ServiceMonitor whose labels miss the serviceMonitorSelector: nothing is scraped, nothing complains. Each unique combination of name and labels is one time series. Names use base units (_seconds, _bytes); counters end in _total.
Metric types and when to use each
Histogram versus summary is a standard question. A histogram is a set of counters, so the server can add buckets across 50 pods and compute any quantile. A summary computes the quantile inside the process, and p99 values cannot be averaged across pods. Choose histograms; the price is picking buckets in advance.
Labels and cardinality
Labels are what make PromQL useful: sum by (status) or {namespace="shop"}. The cost: every distinct label value set is a new series held in memory. The Prometheus docs say it plainly: no labels for unbounded sets such as user IDs or email addresses.
A latency histogram with 15 buckets exposes 17 series (buckets plus _sum and _count) per label combination. With method (5), route (20) and status (5): 500 combinations, 8,500 series. Add user_id with one million users: 17 million series from one metric. Prometheus falls over at a few million series on a normal machine, during the incident you need it for. Raw request paths (/orders/8812 instead of /orders/{id}) do the same.
The four golden signals, RED and USE
The SRE book's four golden signals for any service are latency, traffic, errors and saturation. Two shorthand methods map them to dashboards: RED for request-driven services (Rate in requests per second, Errors as a ratio, Duration as p50, p95, p99), the dashboard every service should have, and USE for resources such as CPU or a connection pool (Utilisation, Saturation meaning work waiting, Errors). Alert on RED, the symptoms users feel; look at USE to find the cause.
PromQL: the queries every on-call engineer needs
A metric name alone returns an instant vector, the latest value of every matching series; name[5m] returns a range vector, the samples of the last 5 minutes, which rate takes.
# Requests per second per service. rate() undoes counter resets and
# extrapolates to the window edges.
sum by (service) (rate(http_requests_total[5m]))

# Error ratio: 5xx over everything, both sides aggregated the same way.
sum by (service) (rate(http_requests_total{status=~"5.."}[5m]))
  /
sum by (service) (rate(http_requests_total[5m]))

# p95 latency: aggregate the buckets first, keep le.
histogram_quantile(0.95, sum by (le, service) (rate(http_request_duration_seconds_bucket[5m])))

# Requests in the last hour: rate() times the window, so it can be a non-integer.
increase(http_requests_total{service="checkout"}[1h])

# A dead exporter produces no series, not a zero: absent() returns 1 then.
absent(up{job="checkout"})
The rate window versus the scrape interval is the subtlety interviewers test. rate() needs at least two samples in the window. With a 15 s scrape, rate(x[15s]) usually holds one sample and returns nothing, and rate(x[30s]) breaks whenever a scrape is late. Use at least four scrape intervals ([1m] at 15 s) and [5m] for alerts. irate() uses only the last two samples: for graphs, never alerts. And always rate() first, then sum: a sum of counters drops whenever one pod restarts, and its rate is garbage.
Exporters and instrumenting your own app
An exporter turns something that does not speak Prometheus into a /metrics page. In every cluster: node_exporter (CPU, memory, disk, network per node), kube-state-metrics (object state: replicas desired versus available, pod phase, restarts, requests and limits), cAdvisor (inside kubelet: per-container CPU and memory), and blackbox_exporter (probes an HTTP, TCP, DNS or ICMP endpoint from outside; an uptime monitor starts here).
Your own service uses a client library (Go client_golang, Python prometheus_client, or the OpenTelemetry SDK) and exposes /metrics:
from prometheus_client import Counter, Histogram, start_http_server

REQUESTS = Counter("http_requests_total", "Requests", ["method", "route", "status"])
LATENCY = Histogram("http_request_duration_seconds", "Latency", ["route"],
                    buckets=(0.01, 0.05, 0.1, 0.25, 0.5, 1, 2.5, 5))

def handle(method, route):
    with LATENCY.labels(route=route).time():
        status = do_work()
    REQUESTS.labels(method, route, str(status)).inc()

start_http_server(9100)   # serves /metrics
Recording rules, alerting rules and Alertmanager
A recording rule precomputes a query on a schedule and stores the result as a new series, named level:metric:operations, so dashboards and alerts read one cheap series instead of summing 2,000 pods. An alerting rule evaluates an expression every evaluation_interval and, once it has held for the for duration, sends the alert to Alertmanager; until then it is pending.
groups:
  - name: checkout
    interval: 30s
    rules:
      - record: service:http_errors:ratio_rate5m
        expr: |
          sum by (service) (rate(http_requests_total{status=~"5.."}[5m]))
            / sum by (service) (rate(http_requests_total[5m]))
      - alert: CheckoutHighErrorRatio
        expr: service:http_errors:ratio_rate5m{service="checkout"} > 0.05
        for: 5m                     # a shorter blip never fires
        labels:
          severity: page
        annotations:
          summary: "checkout error ratio is {{ $value | humanizePercentage }}"
          runbook_url: https://runbooks.example.internal/checkout-errors
Alertmanager decides who hears about an alert. The routing tree matches on labels (severity: page goes to PagerDuty, ticket to Slack or Jira). Grouping (group_by: [alertname, namespace]) folds 200 pod alerts into one notification; group_wait (default 30s) lets the group fill first, group_interval (default 5m) spaces updates, repeat_interval (default 4h) re-sends an unresolved alert. Inhibition mutes alerts while a bigger one fires: ClusterUnreachable suppresses every TargetDown in that cluster (inhibit_rules with source_matchers, target_matchers and equal). Silences mute matching alerts for a window, set before maintenance. Run 3 replicas.
Long-term storage
One Prometheus keeps data locally in 2 hour blocks behind a write-ahead log, for --storage.tsdb.retention.time (default 15d). It does not replicate or shard. For many clusters, a year of history, or one global view, you remote-write to Thanos or Grafana Mimir, which speak PromQL and keep blocks in object storage. The Google ancestor is Monarch, its planet-scale in-memory time series database: regional ingestion, a global query layer, a hard cardinality limit per tenant.
Grafana
Grafana queries all three stores and draws the panels. The rules:
- Dashboards as code. A dashboard is JSON. Keep it in Git and load it by provisioning (a ConfigMap labelled
grafana_dashboard: "1"with the kube-prometheus-stack sidecar, or Terraform's Grafana provider). A dashboard edited in the browser was never reviewed. - Variables.
$servicefromlabel_values(http_requests_total, service), so one dashboard serves 200 services. - The dashboard every service gets: a top row of RED panels (requests per second, error ratio, p50/p95/p99), a second row of saturation (CPU and memory against limits, restarts, replicas ready), a third row of dependencies. Generated from one template.
- Avoid sprawl. One dashboard per service from the template, one per platform component, each with an owner in the title; delete the rest.
Structured logging
A structured log is one JSON object per line, with every fact as a key:
{"ts":"2026-11-04T14:10:07.412Z","level":"error","msg":"payment declined","service":"checkout","trace_id":"4bf92f3577b34da6a3ce929d0e0e4736","request_id":"c1f4e0a9","duration_ms":212,"order_id":8812}
Compare ERROR payment declined for order 8812 after 212ms. The text line has no fields, so Loki's | json | order_id = 8812 has nothing to match, a query cannot group by service, and duration_ms > 1000 becomes a regex that breaks when someone rewords the message. Correlation breaks too: without trace_id and request_id as keys, the 40 lines of one request across six services cannot be pulled out of a million, and Grafana cannot link the line to its trace. Use log/slog in Go or a JSON formatter for Python's logging, and put the request's fields as keys, never pasted into msg.
Levels: debug off in production, info at most one line per request, warn for what will become a problem, error for failed work. info inside a loop is how teams reach 1 TB per day.
Shipping and querying logs
The app writes to stdout, the runtime writes it to a file on the node, a DaemonSet agent (the OpenTelemetry Collector with the filelog receiver and k8sattributes processor, or Fluent Bit) reads the files, adds namespace and pod labels and pushes to the store. Loki indexes only the labels, not the text, and keeps lines compressed in object storage: cheap, and you "select a stream by labels, then grep". The ELK stack (Elasticsearch, Logstash, Kibana) indexes every field: fast queries, expensive cluster.
Two LogQL queries (Loki's language):
# Lines containing "error", parsed as JSON, filtered to one order.
{namespace="shop", app="checkout"} |= "error" | json | order_id = 8812

# Error lines per second by pod: a metric query over logs, drawn in Grafana.
sum by (pod) (rate({namespace="shop", app="checkout"} |= "error" [5m]))
Retention is a cost decision: 7 to 14 days for most services, 90 days or more for audit logs in a cheaper tier.
Traces
A trace is the tree of spans produced by one request: each span is one unit of work (an HTTP handler, a database query) with a name, start time, duration, attributes and a parent. Six services calling each other give one trace of at least six spans, drawn as a waterfall: 420 ms total, of which 380 ms was the inventory service waiting on one slow SQL query. Logs from six services cannot show that: no shared clock, no parent. This is Google's Dapper design: a trace id made at the edge, propagated in every call, spans sampled and collected out of band.
Context propagation is how the id travels. The W3C traceparent header carries version-traceid-parentid-flags, for example 00-4bf92f3577b34da6a3ce929d0e0e4736-00f067aa0ba902b7-01: a 32 hex character trace id, a 16 hex character parent span id, and 01 meaning sampled. Instrumented HTTP libraries read and write it automatically; for Kafka and SQS the same values ride in message headers.
Sampling keeps cost sane. Head sampling decides at the root (keep 10 percent of trace ids): cheap, but it cannot know the trace will contain an error. Tail sampling decides once the whole trace reaches a collector (keep every trace with an error or over 1 s, plus 5 percent of the rest): better, but every span of a trace must reach the same collector instance, which costs memory and a load-balancing step. Stores: Grafana Tempo, Jaeger.
OpenTelemetry: the standard
OpenTelemetry (OTel) is the CNCF project that replaced the vendor SDKs. It defines the API and SDK for every language, the OTLP wire protocol (gRPC on 4317, HTTP on 4318), semantic conventions (http.response.status_code, k8s.pod.name), and the Collector. Auto-instrumentation (a Java agent, a Python wrapper, injected into pods by the OTel Operator) produces spans and metrics for HTTP, gRPC, SQL and queue libraries with no code change; manual spans go only around your own logic.
The Collector is a pipeline of receivers (accept data), processors (transform it) and exporters (send it on), wired under service.pipelines, one per signal. Nothing is active until a pipeline names it:
receivers:
  otlp:
    protocols:
      grpc:
        endpoint: 0.0.0.0:4317
      http:
        endpoint: 0.0.0.0:4318

processors:
  memory_limiter:                  # first: refuse data before the collector OOMs
    check_interval: 1s
    limit_mib: 800
    spike_limit_mib: 200
  k8sattributes: {}                # adds k8s.namespace.name, k8s.pod.name
  batch: {}                        # last: fewer, larger exports

exporters:
  prometheus_remote_write:
    http:
      endpoint: https://mimir:9009/api/v1/push
  otlphttp/loki:                   # type/name: several exporters of one type
    endpoint: https://loki:3100/otlp
  otlp/tempo:
    endpoint: tempo:4317
    tls:
      insecure: true               # inside the cluster only

service:
  pipelines:
    metrics:
      receivers: [otlp]
      processors: [memory_limiter, k8sattributes, batch]
      exporters: [prometheus_remote_write]
    logs:
      receivers: [otlp]
      processors: [memory_limiter, k8sattributes, batch]
      exporters: [otlphttp/loki]
    traces:
      receivers: [otlp]
      processors: [memory_limiter, k8sattributes, batch]
      exporters: [otlp/tempo]
Run it as a DaemonSet (one agent per node) forwarding to a Deployment (gateway) that tail-samples and talks to the backends.
Buy or build: APM products
Datadog, New Relic, Dynatrace and Grafana Cloud sell the whole pipeline as a service: install an agent, get dashboards, APM traces, logs and alerting the same afternoon (100xDevs week 30.2 uses New Relic). A team buys when it is small, has nobody to run Prometheus at 3 a.m., and the bill stays under one engineer's cost. It builds when per-GB and per-host pricing passes that line, when data must stay in-region, or when a platform team already runs Kubernetes. Either way, instrument with OpenTelemetry: switching is then one exporter change.
What observability costs
- Metrics: cost is series, not samples. At 1 to 2 bytes per sample, 10,000 series at 15 s for 30 days is 1.7 billion samples and 1.7 to 3.5 GB (worked example below). With a
user_idlabel it is 17 million series and fits no machine. - Logs: 2,000 pods x 20 lines per second x 250 bytes is 10 MB per second, 864 GB per day raw, about 86 GB per day compressed (assuming 10 to 1), 2.6 TB for 30 days. Hosted products charge per GB ingested: at an assumed 0.50 USD per GB, 432 USD per day.
- Traces: 10,000 requests per second x 8 spans x 500 bytes is 40 MB per second before sampling; at 10 percent, 346 GB per day.
Metrics are the cheapest signal, so alerting is built on them; logs and traces are what you open after the page.
Diagram
Worked example
Part 1: error ratio and p95 by hand. Over the last 5 minutes, after rate() and sum by (le), the checkout latency histogram has these cumulative bucket counts (per-second rates scaled to counts for simplicity): le=0.1: 600, le=0.25: 860, le=0.5: 960, le=1: 990, le=+Inf: 1000. The error counter rate, scaled the same way, is 12.
Error ratio = 12 / 1000 = 0.012, so 1.2 percent of requests failed. Against a 1 percent threshold this alert fires (if it holds for the for duration).
p95: the rank is 0.95 x 1000 = 950. The first bucket whose cumulative count reaches 950 is le=0.5 (960; the one below, le=0.25, has only 860). So p95 lies between 0.25 s and 0.5 s. That bucket holds 960 - 860 = 100 observations and we need the 950 - 860 = 90th of them. Linear interpolation: 0.25 + (0.5 - 0.25) x 90 / 100 = 0.25 + 0.225 = 0.475 s. That is exactly what histogram_quantile(0.95, ...) returns. The true p95 could be anywhere in (0.25, 0.5]; the answer is only as precise as the bucket. p50 by the same method: rank 500 lands in the first bucket (600), lower bound 0, so 0 + 0.1 x 500 / 600 = 0.083 s. If the rank had landed in the +Inf bucket, Prometheus would return 1.0, the upper bound of the highest finite bucket, which is why a p99 that sits flat at your top bucket means "add bigger buckets", not "latency is exactly 1 s".
Part 2: sizing metrics storage. 200 services x 50 series each = 10,000 series. At a 15 s scrape, that is 10,000 / 15 = 667 samples per second. Over 30 days: 667 x 86,400 x 30 = 1.73 billion samples. At the Prometheus rule of thumb of 1 to 2 bytes per sample, disk is 1.7 to 3.5 GB; using the docs formula retention_time_seconds x ingested_samples_per_second x bytes_per_sample with 1.5 bytes: 2,592,000 x 667 x 1.5 = 2.6 GB. Tiny. Now the realistic case: each service has 3 histograms with 15 buckets across 5 routes and 5 statuses, plus the kube-state-metrics and cAdvisor series for its pods, about 2,000 series per service. 400,000 series, 26,667 samples per second, 69 billion samples in 30 days, about 104 GB at 1.5 bytes. Still fine on one disk; what breaks first is memory, since every active series costs a few KB in the head block, so 400,000 series needs on the order of a few GB of RAM, and 17 million (the user_id mistake) needs a machine that does not exist.
Runnable code
"""A tiny Prometheus-style time series store, to make rate(), histogram_quantile()
and alert evaluation concrete.

Everything is in memory and nothing talks to the network. The store keeps
(timestamp, value) samples per series, exactly like a scrape would produce every
15 seconds. rate() follows the extrapolation rules Prometheus uses, and
histogram_quantile() interpolates inside the bucket the way Prometheus does.
"""
import random

SCRAPE = 15  # seconds between samples, like scrape_interval: 15s


class Store:
    def __init__(self):
        self.series = {}  # name -> list of (ts, value)

    def scrape(self, name, ts, value):
        self.series.setdefault(name, []).append((ts, value))

    def window(self, name, end, seconds):
        """Samples with end - seconds < ts <= end, like name[seconds] evaluated at end."""
        return [(t, v) for t, v in self.series.get(name, []) if end - seconds < t <= end]


def rate(samples, range_seconds, range_end):
    """Per-second rate of a counter over a range, the way Prometheus computes it.

    1. Fewer than two samples: no result (this is why rate(x[15s]) with a 15 s
       scrape interval returns nothing).
    2. Add back counter resets: each drop in value is treated as a restart.
    3. Extrapolate to the edges of the range, unless the gap to an edge is more
       than 1.1 x the average sample spacing, in which case extend by half a step.
    """
    if len(samples) < 2:
        return None
    first_t, first_v = samples[0]
    last_t, last_v = samples[-1]
    total = last_v - first_v
    prev = first_v
    for _, v in samples[1:]:
        if v < prev:          # counter reset: the process restarted at 0
            total += prev
        prev = v
    sampled = last_t - first_t
    avg_step = sampled / (len(samples) - 1)
    threshold = avg_step * 1.1
    to_start = first_t - (range_end - range_seconds)
    to_end = range_end - last_t
    if to_start >= threshold:
        to_start = avg_step / 2
    if total > 0 and first_v >= 0:
        # do not extrapolate below zero: a counter cannot have been negative
        to_zero = sampled * (first_v / total)
        to_start = min(to_start, to_zero)
    if to_end >= threshold:
        to_end = avg_step / 2
    factor = (sampled + to_start + to_end) / sampled
    return total * factor / range_seconds


class Histogram:
    """A classic Prometheus histogram: cumulative buckets with an upper bound 'le'."""

    def __init__(self, bounds):
        self.bounds = list(bounds) + [float("inf")]
        self.counts = [0] * len(self.bounds)
        self.total = 0.0
        self.observations = []  # kept only so we can check the quantile by brute force

    def observe(self, v):
        self.observations.append(v)
        self.total += v
        for i, le in enumerate(self.bounds):
            if v <= le:
                self.counts[i] += 1  # cumulative: every bucket at or above v grows


def histogram_quantile(q, bounds, counts):
    """Estimate the q-quantile from cumulative bucket counts, as Prometheus does.

    Find the bucket whose cumulative count first reaches rank = q * total, then
    assume observations are spread evenly inside that bucket (linear interpolation).
    If the rank lands in the +Inf bucket, return the upper bound of the bucket
    below it: that is all Prometheus can know.
    """
    total = counts[-1]
    if total == 0 or len(counts) < 2:
        return float("nan")
    rank = q * total
    b = next(i for i, c in enumerate(counts) if c >= rank)
    if b == len(counts) - 1:
        return bounds[-2]
    lo = 0.0 if b == 0 else bounds[b - 1]
    hi = bounds[b]
    in_bucket = counts[b] - (counts[b - 1] if b > 0 else 0)
    rank_in_bucket = rank - (counts[b - 1] if b > 0 else 0)
    return lo + (hi - lo) * (rank_in_bucket / in_bucket)


def brute_quantile(values, q):
    s = sorted(values)
    return s[max(0, int(round(q * len(s))) - 1)]


def evaluate_alert(store, name, expr, for_seconds, start, end, step):
    """Run an alerting rule every 'step' seconds. States: inactive, pending, firing."""
    state, since, timeline = "inactive", None, []
    for ts in range(start, end + 1, step):
        active = expr(store, ts)
        if not active:
            new = "inactive"
        elif state == "inactive":
            new, since = "pending", ts
        elif state == "pending" and ts - since >= for_seconds:
            new = "firing"
        else:
            new = state
        if new != state:
            timeline.append((ts, new))
            print(f"  t={ts:5d}s  {name}: {state} -> {new}")
        state = new
    return timeline


if __name__ == "__main__":
    random.seed(7)
    store = Store()

    # 1. A counter scraped every 15 s for 10 minutes at 20 req/s, with a restart at t=300.
    print("1. rate() over a counter")
    value = 0
    for ts in range(0, 601, SCRAPE):
        if ts == 300:
            value = 0  # the process restarted and the counter went back to zero
        store.scrape("http_requests_total", ts, value)
        value += 20 * SCRAPE
    r5m = rate(store.window("http_requests_total", 600, 300), 300, 600)
    r15s = rate(store.window("http_requests_total", 600, 15), 15, 600)
    print(f"  rate(http_requests_total[5m]) at t=600  = {r5m:.2f} req/s (true rate 20, reset handled)")
    print(f"  rate(http_requests_total[15s]) at t=600 = {r15s}  <- one sample in the window, no result")
    assert abs(r5m - 20) < 0.5 and r15s is None
    r1m = rate(store.window("http_requests_total", 600, 60), 60, 600)
    print(f"  rate(http_requests_total[1m]) at t=600  = {r1m:.2f} req/s (4 samples, works)")

    # 2. A histogram of request latency and histogram_quantile(0.95).
    print("\n2. histogram_quantile(0.95, ...) with linear interpolation inside the bucket")
    h = Histogram([0.05, 0.1, 0.25, 0.5, 1.0, 2.5])
    for _ in range(5000):
        h.observe(random.lognormvariate(-2.3, 0.8))  # most requests near 100 ms, a long tail
    for le, c in zip(h.bounds, h.counts):
        print(f"  le={le:<5} cumulative count={c}")
    est = histogram_quantile(0.95, h.bounds, h.counts)
    true = brute_quantile(h.observations, 0.95)
    print(f"  histogram_quantile(0.95) = {est:.4f} s, brute-force p95 = {true:.4f} s")
    b = next(i for i, c in enumerate(h.counts) if c >= 0.95 * h.counts[-1])
    lo = 0.0 if b == 0 else h.bounds[b - 1]
    assert lo <= true <= h.bounds[b], "true p95 must lie in the bucket Prometheus picked"
    assert abs(est - true) <= h.bounds[b] - lo, "error is bounded by the bucket width"
    print(f"  both lie in bucket ({lo}, {h.bounds[b]}]; the error is at most the bucket width")
    print(f"  average latency = {h.total / h.counts[-1]:.4f} s  (sum / count, hides the tail)")

    # 3. An alerting rule with a 'for' clause over fake error-ratio data.
    print("\n3. alert HighErrorRatio: expr = error ratio over 1m > 0.05, for: 2m, evaluated every 15 s")
    err = 0
    total = 0
    for ts in range(0, 1201, SCRAPE):
        store.scrape("req_total", ts, total)
        store.scrape("req_errors_total", ts, err)
        total += 20 * SCRAPE
        # errors: 0.5% normally, 10% between t=400 and t=430 (a blip), 10% from t=700 to t=1000
        bad = 0.10 if 400 <= ts < 430 or 700 <= ts < 1000 else 0.005
        err += int(20 * SCRAPE * bad)

    def error_ratio(st, ts):
        e = rate(st.window("req_errors_total", ts, 60), 60, ts)
        t = rate(st.window("req_total", ts, 60), 60, ts)
        return e is not None and t and e / t > 0.05

    timeline = evaluate_alert(store, "HighErrorRatio", error_ratio, 120, 60, 1200, SCRAPE)
    states = [s for _, s in timeline]
    firing_at = [t for t, s in timeline if s == "firing"]
    assert states.count("firing") == 1, "the 30 s blip must not fire; 'for: 2m' filtered it"
    assert 700 + 120 <= firing_at[0] <= 700 + 120 + 60 + SCRAPE, "fires about 2 min into the real incident"
    print(f"  fired once, at t={firing_at[0]}s: the 30 s blip stayed pending and never paged anyone")
    print("\nall checks passed")
Key takeaways
Metrics tell you something is wrong, logs tell you what a process did, traces tell you where a request spent its time. Alert on metrics; open logs and traces after the page.
Prometheus pulls
/metricsfrom targets found by service discovery; on Kubernetes you declare targets with ServiceMonitors and the Operator does the rest.Use counters with
rate(), gauges raw, histograms withhistogram_quantile()overrate()of buckets. Avoid summaries: their quantiles cannot be aggregated.Cost is cardinality. Never put user ids, request ids or raw paths in labels; count the series before you add a label.
rate()needs at least two samples: the window must be at least four scrape intervals, and alwaysratefirst, thensum.Alerting rules with
forfilter blips; Alertmanager groups, routes, inhibits and silences; recording rules make dashboards and alerts cheap.Logs are JSON lines with a trace id, shipped by a DaemonSet agent to Loki; traces propagate W3C
traceparentand are sampled; OpenTelemetry is the one SDK and collector for all three.The bill is ingest per day x retention, plus cardinality for metrics. Log less at info and sample traces before buying a bigger cluster.
Common mistakes
rate(x[15s])orrate(x[30s])with a 15 s scrape interval: empty graphs and flapping alerts. Use at least[1m],[5m]for alerts.sum(x)thenrate(): one pod restart resets the sum and the rate goes negative or spikes. Rate per series, then sum.Averaging p99 values across pods, or using
_sum / _countand calling it latency. The average hides the tail; use histogram buckets.A
user_id,email,request_idor raw URL path label. Series explode and Prometheus dies during the incident.A ServiceMonitor whose labels do not match the Prometheus
serviceMonitorSelector, so nothing is scraped and no error appears. Check Status, Targets in the Prometheus UI.Alerts without
for, without a runbook link, or on causes (CPU 80 percent) instead of symptoms (error ratio, latency). They page at 3 a.m. for nothing and get ignored when they matter.
Practice
On kind or minikube, install the kube-prometheus-stack Helm chart, deploy a small HTTP app that exposes
/metricswith a counter and a histogram, add a ServiceMonitor, and confirm the target appears as UP in the Prometheus Targets page. Then break the label selector and watch it vanish without an error.Write the four RED queries (rate, error ratio, p95, p99) for your app and build a Grafana dashboard with a
$servicevariable. Export the dashboard JSON, put it in a ConfigMap and confirm it survives deleting the Grafana pod.Add an alerting rule with
for: 2mon error ratio above 5 percent, generate errors with a loop ofcurlcalls to a failing route, and time how long from the first error until Alertmanager shows the alert firing. Then add a silence and confirm it stops.Run the OpenTelemetry Collector with the config from this lesson pointed at the
debugexporter, send a trace with theotel-clior a Python app using the OTLP exporter, and confirm thetraceparentheader is forwarded on an outgoing HTTP call by logging request headers in a second service.
Interview questions (12)
1.Write the PromQL for p95 latency of the checkout service and explain each part.Medium
histogram_quantile(0.95, sum by (le) (rate(http_request_duration_seconds_bucket{service="checkout"}[5m]))). The _bucket series are cumulative counters, one per upper bound le. rate over 5 minutes turns them into per-second rates and handles restarts. sum by (le) adds up the buckets across all pods while keeping the le label, which histogram_quantile needs. The function then finds the bucket where the 95th percentile falls and interpolates linearly inside it. The answer is only as precise as the bucket boundaries, so if p95 sits flat at the top finite bucket the real value is above it and the buckets need extending.
2.Why does rate() need a window longer than the scrape interval, and how long should it be?Medium
rate needs at least two samples inside the range to compute a slope. With a 15 second scrape, a 15 second window usually holds one sample and returns nothing, and a 30 second window breaks whenever one scrape arrives late. The rule of thumb is a window of at least four scrape intervals, so one minute at 15 seconds, and five minutes for alerting rules so a missed scrape does not flap the alert. rate also extrapolates to the window edges and corrects counter resets, which is why you never use plain subtraction or irate for alerts.
3.Why is user_id a bad label in Prometheus?Easy
Every unique set of label values is a separate time series that Prometheus holds in memory and indexes on disk. A label with one million possible values turns one metric into a million series, times every other label combination, times the 17 series a histogram exposes. The server runs out of memory, scrapes start timing out and queries crawl, usually during the incident you need it for. Labels must have a small, bounded set of values: method, route template, status class, service. Anything per user or per request belongs in logs or trace attributes, which are built for high cardinality.
4.Histogram or summary for request latency, and why?Medium
Histogram. It exposes cumulative bucket counters, so the server can add buckets across all pods and compute any quantile with histogram_quantile, and I can change from p95 to p99 later without touching the code. A summary computes quantiles inside each process, which is more expensive per observation, fixes the quantiles at build time, and cannot be aggregated: averaging the p99 of ten pods is not the p99 of the service. The cost of a histogram is choosing buckets in advance; a dozen buckets from 5 ms to 10 s covers most HTTP services.
5.What is the difference between a recording rule and an alerting rule?Easy
A recording rule evaluates an expression on a schedule and writes the result back as a new series, named like service:http_errors:ratio_rate5m, so dashboards and alerts read one cheap precomputed series instead of summing across thousands of pods on every refresh. An alerting rule evaluates an expression and, when it is true for the for duration, sends an alert with labels and annotations to Alertmanager. Good practice is to build alerts on recorded series: the query is cheap, consistent with the dashboard, and the SLO maths is in one place.
6.An alert fires for 200 pods at once. How do you stop 200 pages?Medium
In Alertmanager. First grouping: group_by: [alertname, namespace] folds them into one notification that lists the pods, with group_wait giving the group 30 seconds to fill. Second inhibition: if the cause is a node or cluster-level alert, an inhibit rule with source_matchers on that alert and equal: [cluster] mutes the pod-level ones. Third, the rule itself: a symptom-based alert on the service's error ratio would have fired once, so the 200 per-pod alerts should probably be tickets, not pages. And during planned maintenance, a silence with a matcher on the namespace.
7.A user says checkout is slow. Logs show nothing. What does a trace give you that logs cannot?Medium
A trace shows one request's spans across every service with a shared clock and parent-child structure, so I can see that the 420 ms request spent 380 ms inside the inventory service's database call, even though each service's own logs say it was healthy. Logs from six services are six separate timelines with no link between them unless every line carries the trace id. With the id, I go from a slow log line to the trace in Tempo and back. Without tracing, I would have to guess which service to look at and correlate timestamps by hand.
8.Explain head versus tail sampling and when you would use each.Medium
Head sampling decides at the root of the trace, usually by trace id ratio: keep 10 percent. It is cheap, needs no extra infrastructure, and every service makes the same decision because the sampled flag travels in traceparent. Its weakness is that it cannot know whether the trace will contain an error or be slow. Tail sampling waits until all spans of a trace reach a collector, then keeps every trace with an error or above a latency threshold plus a small fraction of the rest. That is what you want for debugging, but every span of a trace must land on the same collector, which needs a load-balancing exporter and memory for buffering. Small teams start with head sampling; high-volume services move to tail sampling at a gateway collector.
9.What does the OpenTelemetry Collector do and why not send directly to the backend?Easy
The collector is a pipeline process: receivers accept data (OTLP, Prometheus scrape, log files), processors transform it (memory limiter, batching, adding Kubernetes attributes, tail sampling, dropping noisy data), and exporters send it to backends. Sending directly from the app works for a demo but ties every service to the backend's address and credentials, makes the app retry and buffer during outages, and means switching vendors is a change in every service. With the collector, the app only knows one OTLP endpoint; retries, batching, enrichment and the choice of Prometheus, Loki, Tempo or Datadog live in one config.
10.Checkout's error ratio alert fires. Walk me through the first five minutes.Hard
Acknowledge the page and open the checkout RED dashboard. Check which panel moved: errors, latency or rate. Run the error query split by status and route: sum by (status, route) (rate(http_requests_total{service="checkout", status=~"5.."}[5m])). If one route, it is usually a code path or a dependency; if all routes, it is the service or its platform. Check kube_deployment_status_replicas_available and restarts for a bad rollout, which is the most common cause, and roll back if the timing matches a deploy. Open Loki for level=error on that route in the last 15 minutes and take a trace id from a line into Tempo to see which downstream call fails. Mitigate first: rollback, scale up or flag off. Understanding the root cause comes after the error ratio is back under the threshold.
11.How would you size Prometheus for 200 services?Medium
Count series, not services. With a realistic 2,000 series per service including histograms, kube-state-metrics and cAdvisor, that is 400,000 series. At a 15 second scrape that is about 27,000 samples per second and 69 billion samples in 30 days; at 1 to 2 bytes per sample that is roughly 70 to 140 GB of disk, which is fine. Memory is the real limit, since every active series costs a few kilobytes in the head block, so I plan several gigabytes of RAM and watch prometheus_tsdb_head_series. For longer retention or many clusters I remote-write to Mimir or Thanos and keep local retention short. The biggest lever is relabelling to drop series nobody queries.
12.When should a team buy Datadog or New Relic instead of running Prometheus and Grafana?Easy
When the team is small, nobody wants to be on call for the monitoring stack itself, and the bill stays below the cost of one engineer. Hosted APM gives dashboards, traces and alerting the same day. The open-source stack wins when ingest volume makes per-GB and per-host pricing larger than running Mimir, Loki and Tempo, when data residency matters, or when there is already a platform team running Kubernetes. Either way the answer is to instrument with OpenTelemetry, so the choice is an exporter setting in the collector, not a rewrite of every service.
Quiz
1.Which query gives the p95 latency across all pods of a service?
2.Scrape interval is 15 s. Which rate window is safe for an alerting rule?
3.What is the main cost driver of a Prometheus deployment?
4.An alert has `for: 5m`. The expression has been true for 3 minutes. What state is the alert in?
5.In the OpenTelemetry Collector, where is the batch processor placed?
6.What does a W3C traceparent header carry?
Practice these problems
Further reading
My notes
Your notes
Autosaves to this browser.