Kubernetes in production - resources, autoscaling, RBAC, upgrades, EKS
Running Kubernetes in production is a set of decisions that nobody makes for you: how much CPU and memory each pod asks for, which pods die first when a node is full, how probes are timed, where pods may be scheduled, how pods and nodes scale, who may do what, what a pod may not do, and how to upgrade without an outage. This lesson covers each decision with the field names, the defaults and the numbers, and ends with a production checklist.
Why it matters
Senior Kubernetes interviews are about production behaviour, not objects: "why is this pod OOMKilled when the node has free memory", "why did the HPA scale to max and stay there", "how would you upgrade a cluster with 300 services and no maintenance window", "can this developer delete that Secret". Each has a precise answer. On the job, these settings are the difference between a cluster that absorbs a traffic spike and one that pages you. Platform roles in Indian product companies and GCCs expect you to own them, and the eks-cluster-platform and autoscaling-web-app design problems are built on them.
Read first: Kubernetes architecture and core objects, Kubernetes networking and storage, AWS managed platforms - EKS, ECS, Fargate, Lambda, SQS, ElastiCache, CloudFront
Lesson
Requests, limits and the kernel
A request is what the scheduler reserves for a container and what the HPA measures utilisation against. A limit is what the kernel enforces. They are enforced differently.
CPU is compressible. A CPU request becomes a cgroup weight, so under contention a pod gets at least its share and can use idle CPU above it. A CPU limit becomes a CFS quota: the container may run for limit worth of time in each 100 ms period and is then paused until the next period, even if the node is idle. That pause is throttling, and it adds latency that you only see in container_cpu_cfs_throttled_periods_total. A request needing 30 ms of CPU under a 250m limit (25 ms per period) always crosses a period boundary. The case against CPU limits: requests already protect neighbours through weights, so limits add latency without adding safety. Many teams set CPU requests and no CPU limits, keeping limits for untrusted or batch work.
Memory is not compressible. A memory request is used for scheduling and eviction decisions; a memory limit is a hard cgroup ceiling and exceeding it gets the process killed by the kernel with OOMKilled in the pod's last state, exit code 137. The node can have free memory; the limit is per container. Set memory requests from measured usage and make the limit equal to the request for anything that matters.
resources:
  requests:
    cpu: 400m        # measured p99 of per-pod usage, see the worked example
    memory: 512Mi
  limits:
    memory: 512Mi    # equal to the request; no CPU limit
QoS classes, eviction, LimitRange and ResourceQuota
The kubelet assigns a QoS class from the resources alone. Guaranteed: every container has CPU and memory requests equal to limits. Burstable: at least one request or limit is set but the pod is not Guaranteed. BestEffort: nothing set. When a node runs short of memory or disk (the defaults are memory.available<100Mi, nodefs.available<10%, imagefs.available<15%), the kubelet evicts pods: first those whose usage exceeds their requests, ordered by priority and by how far over they are; Guaranteed pods and Burstable pods under their requests go last. A BestEffort pod has a request of zero, so any usage is over it, which is why it goes first.
A LimitRange sets per-container defaults and bounds in a namespace, so a Deployment with no resources still gets a request. A ResourceQuota caps the namespace's total requests, limits, storage and object counts; once a quota exists, every pod must set the quoted resources or it is rejected.
apiVersion: v1
kind: LimitRange
metadata:
  name: defaults
  namespace: payments
spec:
  limits:
    - type: Container
      defaultRequest:
        cpu: 100m
        memory: 128Mi
      default:
        memory: 256Mi
      max:
        memory: 4Gi
---
apiVersion: v1
kind: ResourceQuota
metadata:
  name: team-quota
  namespace: payments
spec:
  hard:
    requests.cpu: "40"
    requests.memory: 80Gi
    limits.memory: 120Gi
    persistentvolumeclaims: "20"
Probes and the three ways they cause outages
A startup probe runs first and disables the other two until it passes; give it failureThreshold x periodSeconds of at least the worst-case start time (30 x 10 = 300 s in the docs example). Readiness controls membership in Service endpoints and never restarts anything. Liveness restarts the container.
The three outage patterns. First, liveness stricter than the app: a 1 s timeout on a JVM under GC pauses, so healthy pods are restarted in a loop while traffic lands on fewer and fewer pods. Second, a readiness probe that checks a dependency (the database) during a dependency incident: every pod goes unready at once, the Service has no endpoints and a partial outage becomes total. Third, no readiness probe, or one that returns 200 before the app has loaded its config: a rollout with maxUnavailable: 0 replaces working pods with pods that cannot serve, and the rollout succeeds. Rules: liveness checks only the process, readiness may check what the pod needs to serve, and a failing shared dependency should degrade the pod, not unready it. The bad-deploy-readiness-probes problem is pattern three.
Scheduling controls
topologySpreadConstraints:
  - maxSkew: 1
    topologyKey: topology.kubernetes.io/zone
    whenUnsatisfiable: DoNotSchedule
    labelSelector:
      matchLabels:
        app: api
---
apiVersion: policy/v1
kind: PodDisruptionBudget
metadata:
  name: api
spec:
  minAvailable: 2          # or maxUnavailable: 25%; percentages round up
  selector:
    matchLabels:
      app: api
kubectl drain NODE cordons the node (marks it unschedulable) and evicts every pod through the Eviction API, which honours PDBs: an eviction that would break a budget is refused and drain retries. Deleting a pod directly does not check PDBs. A PDB with minAvailable equal to the replica count can never be satisfied during a drain and blocks every node upgrade: the most common PDB mistake.
Autoscaling at three levels
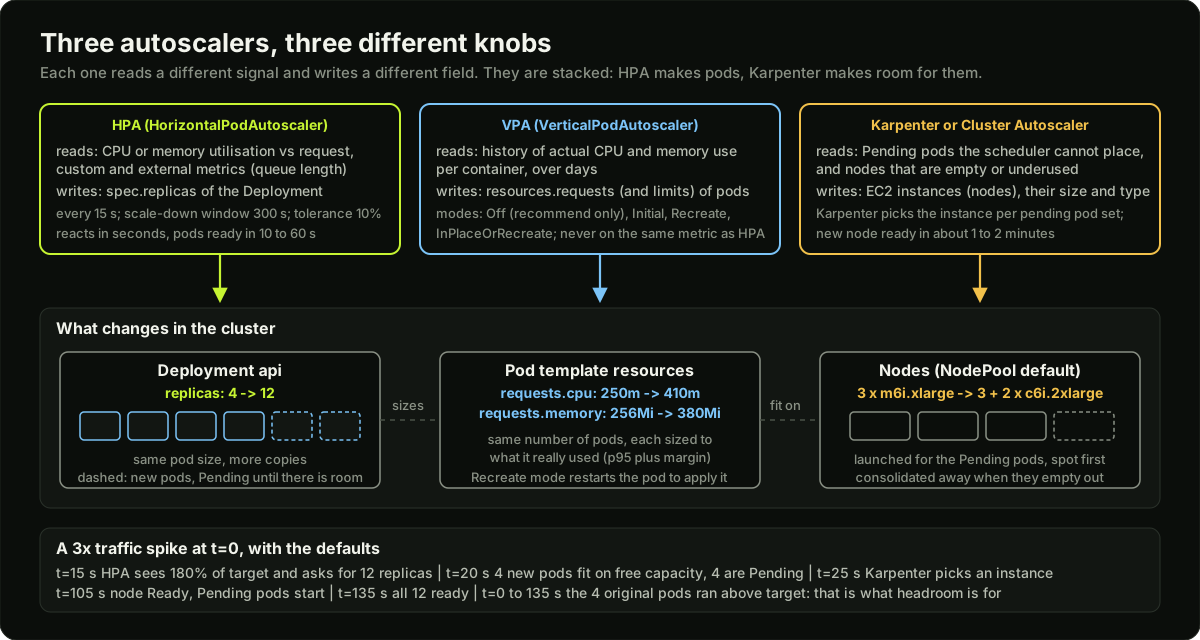 HPA, VPA and Karpenter side by side: what each reads, what each writes, and a timeline of a 3x traffic spike
The HorizontalPodAutoscaler needs metrics-server for CPU and memory. Every 15 s it computes desiredReplicas = ceil(currentReplicas x currentMetric / targetMetric), ignores changes within a 10 percent tolerance, and scales up at once (at most the larger of 4 pods or 100 percent per 15 s) but scales down using the highest recommendation of the last 300 s (behavior.scaleDown.stabilizationWindowSeconds). Utilisation is a percentage of the request, so a pod without requests cannot be autoscaled on CPU. Custom metrics (requests per second, queue depth) arrive through the Prometheus adapter as Pods or External metrics.
apiVersion: autoscaling/v2
kind: HorizontalPodAutoscaler
metadata:
  name: api
spec:
  scaleTargetRef:
    apiVersion: apps/v1
    kind: Deployment
    name: api
  minReplicas: 3
  maxReplicas: 30
  metrics:
    - type: Resource
      resource:
        name: cpu
        target:
          type: Utilization
          averageUtilization: 60     # of the CPU request
  behavior:
    scaleDown:
      stabilizationWindowSeconds: 600
      policies:
        - type: Percent
          value: 20
          periodSeconds: 60          # remove at most 20 percent per minute
The VerticalPodAutoscaler watches real usage over days and recommends requests. updateMode: "Off" only writes recommendations into the VPA status, which is the safe way to size a service; Recreate restarts pods to apply them; InPlaceOrRecreate resizes in place where the cluster supports it. Never let VPA and HPA both act on CPU for the same pods: one changes the request and the other scales on utilisation of that request.
KEDA is for event-driven scaling. A ScaledObject names the Deployment and a trigger (SQS queue length, Kafka consumer lag, a Prometheus query), and KEDA creates and feeds an HPA with that metric. It also scales to zero when the trigger is idle and back to one when work arrives, which an HPA cannot do.
Cluster autoscaling adds nodes when pods are Pending for lack of resources. The Cluster Autoscaler works on node groups: it picks a group whose instance type fits the pods and raises the Auto Scaling group's desired count, then removes nodes that have been under 50 percent requested for 10 minutes (scale-down-unneeded-time), unless a pod there has a strict PDB, local storage or no controller. Karpenter has no node groups. A NodePool lists the allowed instance families, architectures and capacity types; for each batch of Pending pods it computes the cheapest instance that fits them and launches it directly, usually ready within a couple of minutes. Consolidation (consolidationPolicy: WhenEmptyOrUnderutilized) replaces several underused nodes with fewer or cheaper ones, and disruption.budgets limits how many nodes it may disrupt at once, including a schedule for "none during business hours". For spot, Karpenter handles the interruption notice by draining the node before reclaim; listing spot and on-demand together lets it fall back when spot is unavailable.
apiVersion: karpenter.sh/v1
kind: NodePool
metadata:
  name: general
spec:
  template:
    spec:
      nodeClassRef:
        group: karpenter.k8s.aws
        kind: EC2NodeClass
        name: default
      expireAfter: 720h                      # replace nodes after 30 days (AMI refresh)
      requirements:
        - key: karpenter.sh/capacity-type
          operator: In
          values: ["spot", "on-demand"]
        - key: karpenter.k8s.aws/instance-category
          operator: In
          values: ["c", "m", "r"]
        - key: kubernetes.io/arch
          operator: In
          values: ["amd64", "arm64"]
  disruption:
    consolidationPolicy: WhenEmptyOrUnderutilized
    consolidateAfter: 1m
    budgets:
      - nodes: 10%
      - schedule: "0 9 * * mon-fri"
        duration: 9h
        nodes: "0"                           # no consolidation in business hours
  limits:
    cpu: "500"
RBAC, Pod Security Standards and admission control
RBAC has four objects. A Role is a list of rules (API groups, resources, verbs) inside a namespace; a ClusterRole is the same cluster-wide or for non-namespaced resources (nodes, PVs). A RoleBinding gives a Role or ClusterRole to subjects (users, groups, ServiceAccounts) inside one namespace; a ClusterRoleBinding gives a ClusterRole everywhere. Rules are additive only: there is no deny, and a user's permissions are the union of every binding that names them or their groups. Pods act as their ServiceAccount; on EKS, users come from IAM access entries. ClusterRoles can aggregate: a ClusterRole with aggregationRule collects the rules of every ClusterRole carrying a label, which is how the built-in edit and view roles pick up rules for CRDs.
kubectl auth can-i delete secrets -n payments --as dev-priya          # yes or no
kubectl auth can-i --list -n payments --as-group=team-payments        # everything a group may do
kubectl auth can-i get pods --as=system:serviceaccount:ci:deployer    # a ServiceAccount
Pod Security Standards are three levels: privileged (anything), baseline (no host namespaces, no privileged containers, no hostPath), restricted (also non-root, dropped capabilities, seccomp, no privilege escalation). They are applied per namespace with labels, each in a mode: enforce rejects, warn returns a warning, audit records it.
kubectl label ns payments \
  pod-security.kubernetes.io/enforce=baseline \
  pod-security.kubernetes.io/warn=restricted \
  pod-security.kubernetes.io/audit=restricted
Admission webhooks run after authorisation and before the write. A mutating webhook changes the object (inject a sidecar, add labels); a validating webhook accepts or rejects it. Kyverno writes policies as YAML; Gatekeeper uses Rego. Every cluster ends up with three: require CPU and memory requests, forbid the latest tag, require runAsNonRoot. Start each in Audit; switch to Enforce once the report is empty.
apiVersion: kyverno.io/v1
kind: ClusterPolicy
metadata:
  name: require-requests-no-latest
spec:
  rules:
    - name: requests-set
      match:
        any:
          - resources:
              kinds: [Pod]
      validate:
        failureAction: Enforce
        message: "every container needs CPU and memory requests"
        pattern:
          spec:
            containers:
              - resources:
                  requests:
                    cpu: "?*"
                    memory: "?*"
    - name: no-latest-tag
      match:
        any:
          - resources:
              kinds: [Pod]
      validate:
        failureAction: Enforce
        message: "use a pinned image tag, not latest"
        pattern:
          spec:
            containers:
              - image: "!*:latest"
Upgrades, node operations, multi-tenancy and backups
Kubernetes releases three minor versions a year and the version skew policy fixes the order: the API server first; controller-manager and scheduler may be one minor older than it; kubelet may be up to three minors older but never newer; kubectl within one minor either way. So an upgrade is control plane, then add-ons (VPC CNI, CoreDNS, kube-proxy, EBS CSI, each with a compatible version per minor), then nodes. EKS gives each minor 14 months of standard support and then 12 months of extended support at a higher price; at the end of extended support AWS upgrades the control plane for you, without notice, and your nodes and add-ons are then your problem. Check the EKS version page each planning cycle; in November 2026 the standard-support versions are 1.34 to 1.37.
A managed node group upgrade is a surge: it launches new nodes first (the larger of twice the AZ count or maxUnavailable, default 1), then cordons old nodes maxUnavailable at a time, labels them to leave load balancers, drains them, waits for pods to move, and terminates them. Pods that cannot be evicted within 15 minutes fail the upgrade with PodEvictionFailure, which is nearly always a PDB that can never be satisfied or a pod that tolerates every taint. Test the upgrade in staging with the same PDBs, and read the deprecated API list for the target minor (the apiserver_requested_deprecated_apis metric shows who still uses them).
Node problems have signatures. NotReady means the kubelet has not reported for the grace period: read kubectl describe node conditions, then journalctl -u kubelet on the node. MemoryPressure and DiskPressure mean the kubelet is evicting; disk pressure is usually images or container logs, and the kubelet garbage-collects unused images once disk use passes 85 percent (imageGCHighThresholdPercent) down to 80. Pods on a node that stays NotReady are evicted after the default tolerationSeconds: 300 for the unreachable taint.
Multi-tenancy is a choice of boundary. A namespace per team on a shared cluster is cheap and gives RBAC, quota, NetworkPolicy and PSS boundaries, but shares the control plane, the kernel and every add-on. A cluster per environment (dev, staging, prod) is the common split, so an upgrade or a broken add-on in dev cannot touch prod. Split further when a tenant needs a different Kubernetes version or security level, or when one team's API load slows the control plane for all.
Backups are two different things. On EKS, etcd is backed up by AWS and you cannot restore it yourself, so the real backup of cluster state is Git (every object applied by GitOps, lesson 19). Application state is Velero: it stores object manifests in S3 and snapshots PVCs through CSI VolumeSnapshots or copies file data with its node agent, on a schedule (velero schedule create daily --schedule="0 1 * * *"), and restores with velero restore create --from-backup. A backup never restored is not a backup; restore into a scratch namespace monthly.
The production checklist
Diagram
Worked example
Sizing a service and its autoscaling for a 3x spike. The api service serves 1,000 requests per second at normal load. A load test of one pod at 200 requests per second shows CPU p99 of 380m, mean 240m, and memory under 420 MiB.
Step 1, requests and limits. CPU request from the p99, rounded: 400m. Memory request and limit from the p99 plus about 20 percent headroom: 420 x 1.2 = 504, rounded to 512Mi. No CPU limit. The pod is Burstable on CPU (no limit) but memory behaves as Guaranteed.
Step 2, replicas at normal load. 1,000 / 200 = 5 pods carry the load at the measured mean of 240m each, which is 240 / 400 = 60 percent of the request.
Step 3, the HPA target. Pick a target that scales out before pods saturate. At 60 percent the HPA is at target and does nothing; with the 10 percent tolerance a scale-out starts when the ratio passes 1.1, that is 66 percent, 264m per pod, 220 requests per second per pod, well before p99 usage reaches the request. Set averageUtilization: 60, minReplicas: 5.
Step 4, the spike. Traffic goes to 3,000 requests per second. With 5 pods that is 600 requests per second per pod, which needs 600 / 200 x 240 = 720m per pod: 180 percent of the request. The HPA computes ceil(5 x 180 / 60) = 15 replicas. The default scale-up policy allows doubling per 15 s, so it goes 5 to 10 at the first tick and 10 to 15 at the second.
Step 5, nodes. Nodes are m6i.xlarge (4 vCPU, 16 GiB) with about 3,500m allocatable after system reserves and DaemonSets. By CPU, floor(3500 / 400) = 8 pods fit per node; by memory 8 x 512Mi = 4 GiB, no constraint. The existing nodes have room for 3 more pods, so 3 of the 10 new pods schedule at once and 7 go Pending. 7 x 400m = 2,800m fits on one node, so Karpenter launches one m6i.xlarge.
Step 6, time. Karpenter sees the Pending pods within seconds and launches the instance; it joins and is Ready typically a minute or two later, so plan for about 120 s. Add 20 s for image pull and readiness: the 7 Pending pods serve at about t = 140 s. Until then 8 pods carry 3,000 requests per second, 375 each, needing 450m each, 112 percent of the request; with no CPU limit they burst into idle CPU, but the nodes do not have 3,600m spare, so p99 latency rises. If that is unacceptable, buy headroom: minReplicas: 8, or an over-provisioning Deployment of low-priority pause pods that real pods preempt instantly.
Step 7, scale-down. When traffic returns to 1,000, 15 pods sit at 20 percent and the recommendation is 5. The 600 s window in the HPA above holds replicas until every recommendation in the last 10 minutes agrees, then the 20 percent per minute policy walks replicas down from 15 to 5 over several minutes instead of in one jump. Karpenter consolidates the empty node after consolidateAfter: 1m.
Runnable code
"""Part 1: a minute-by-minute HPA simulation.

The controller formula is
    desiredReplicas = ceil(currentReplicas * (currentMetric / targetMetric))
applied every sync (15 s by default; one tick per minute here for readability).
Two safety rails are modelled: the 10 percent tolerance (no change while the
ratio is within 0.9 to 1.1) and the scale-down stabilization window (the
controller uses the highest recommendation of the last N minutes, so replicas
only fall when every recent recommendation agrees). Scale-up has no window.

Load is expressed as total CPU demand in millicores. With R replicas the
per-pod utilisation is demand / (R * request). Real pods take time to become
ready, so a new replica does not share load until the next minute.

Part 2: a QoS classifier that reads container resources the way kubelet does.
"""
import math

REQUEST_M = 500  # CPU request per pod, millicores; utilisation is measured against this


def hpa_run(demand, target_pct, min_r, max_r, start, down_window, tolerance=0.1, label=""):
    """Simulate one HPA for len(demand) minutes. Returns one row per minute."""
    replicas = start
    history = []           # recent recommendations, for the scale-down window
    out = []
    for minute, d in enumerate(demand):
        util = d / (replicas * REQUEST_M) * 100          # percent of request, per pod
        ratio = util / target_pct
        if abs(ratio - 1.0) <= tolerance:
            rec = replicas                                # inside tolerance: no change
        else:
            rec = math.ceil(replicas * ratio)
        rec = max(min_r, min(max_r, rec))
        history.append(rec)
        history = history[-down_window:] if down_window > 0 else [rec]
        if rec > replicas:
            new = rec                                     # scale up: act at once
        else:
            new = max(history)                            # scale down: highest recent recommendation
        out.append((minute, d, replicas, round(util), rec, new))
        replicas = new
    if label:
        print(f"\n{label}")
        print(f"{'min':>3} {'demand m':>9} {'pods':>5} {'util%':>6} {'recommend':>10} {'-> pods':>8}")
        for row in out:
            m, d, r, u, rec, new = row
            flag = " THROTTLED" if u > 100 else ""
            print(f"{m:>3} {d:>9} {r:>5} {u:>6} {rec:>10} {new:>8}{flag}")
    return out


def qos_class(containers):
    """Classify a pod from its containers' resources exactly as the docs define it."""
    def get(c, kind, res):
        return c.get("resources", {}).get(kind, {}).get(res)

    any_set = any(get(c, k, r) for c in containers for k in ("requests", "limits") for r in ("cpu", "memory"))
    if not any_set:
        return "BestEffort"
    guaranteed = all(
        get(c, "requests", r) is not None and get(c, "limits", r) is not None
        and get(c, "requests", r) == get(c, "limits", r)
        for c in containers for r in ("cpu", "memory")
    )
    return "Guaranteed" if guaranteed else "Burstable"


if __name__ == "__main__":
    # A traffic curve: quiet, a 3x ramp over 4 minutes, a bursty plateau that
    # alternates between the peak and half of it every minute, then back down.
    base = 1200  # millicores of total demand at rest: 4 pods at 60 percent of a 500m request
    demand = [base] * 3 + [1800, 2400, 3000, 3600] + [3600, 1800] * 4 + [2400, 1200] + [1200] * 6

    a_rows = hpa_run(demand, target_pct=60, min_r=2, max_r=20, start=4, down_window=5,
                     label="A: target 60%, max 20, scale-down window 5 min")
    good = [row[5] for row in a_rows]
    # 3600m of demand at 60 percent of a 500m request needs 3600 / 300 = 12 pods.
    assert max(good) == 12, max(good)
    assert all(row[3] <= 100 for row in a_rows), "A never let a pod run past 100% of its request"
    assert good[-1] == 4, good[-1]   # back to 4 once the window has drained

    b_rows = hpa_run(demand, target_pct=90, min_r=2, max_r=6, start=4, down_window=0,
                     label="B: target 90%, max 6, no scale-down window (thrash and saturation)")
    bad = [row[5] for row in b_rows]
    assert max(bad) == 6
    # With max 6 the plateau runs at 3600 / (6 * 500) = 120 percent: throttled every minute.
    throttled = sum(1 for row in b_rows if row[3] > 100)
    changes = sum(1 for a, b in zip(bad, bad[1:]) if a != b)
    good_changes = sum(1 for a, b in zip(good, good[1:]) if a != b)
    print(f"\nreplica changes: A made {good_changes}, B made {changes}; B ran pods past 100% in {throttled} minutes")
    assert changes > good_changes and throttled >= 6

    print("\nQoS classes and eviction order (BestEffort first, Guaranteed last)")
    pods = {
        "api (req=lim on both)": [{"resources": {"requests": {"cpu": "500m", "memory": "512Mi"},
                                                 "limits": {"cpu": "500m", "memory": "512Mi"}}}],
        "worker (memory lim only)": [{"resources": {"requests": {"cpu": "250m", "memory": "256Mi"},
                                                    "limits": {"memory": "512Mi"}}}],
        "sidecar pair (one unset)": [{"resources": {"requests": {"cpu": "100m", "memory": "128Mi"},
                                                    "limits": {"cpu": "100m", "memory": "128Mi"}}},
                                     {"resources": {}}],
        "debug pod (nothing set)": [{"resources": {}}],
    }
    order = {"BestEffort": 1, "Burstable": 2, "Guaranteed": 3}
    rows = sorted(((qos_class(c), name) for name, c in pods.items()), key=lambda t: order[t[0]])
    for i, (cls, name) in enumerate(rows, 1):
        print(f"  evicted {i}: {name:<28} {cls}")
    assert qos_class(pods["api (req=lim on both)"]) == "Guaranteed"
    assert qos_class(pods["worker (memory lim only)"]) == "Burstable"
    assert qos_class(pods["sidecar pair (one unset)"]) == "Burstable"   # one container without limits breaks Guaranteed
    assert qos_class(pods["debug pod (nothing set)"]) == "BestEffort"
    print("\nall checks passed")
Key takeaways
Requests drive scheduling, HPA utilisation and eviction order; memory limits are hard and cause OOMKilled; CPU limits cause CFS throttling, so most latency-sensitive services should set CPU requests and no CPU limits.
QoS is derived from resources: Guaranteed needs requests equal to limits on every container; BestEffort is evicted first.
Liveness checks only the process, readiness may check dependencies but must not take every pod out at once, and a startup probe covers slow starters.
Spread with topologySpreadConstraints, protect with PDBs that can actually be satisfied, and know that drain honours PDBs while direct deletion does not.
HPA scales replicas on utilisation of the request with a 300 s scale-down window; KEDA adds event triggers and scale-to-zero; Karpenter adds right-sized nodes in about two minutes, so headroom bridges that gap.
RBAC is additive with no deny; answer "can user X do Y" with
kubectl auth can-i --as; enforce Pod Security Standards with namespace labels and the top three admission policies with Kyverno.Upgrade control plane, then add-ons, then nodes, inside the skew rules and the EKS support window; a PDB that cannot be satisfied blocks every upgrade.
Common mistakes
Setting CPU limits equal to requests "for Guaranteed QoS" on a web service and then hunting a p99 latency problem that is CFS throttling.
A memory limit chosen from average usage; the pod is OOMKilled at the daily peak and the restart loop looks like a crash bug.
HPA target 85 percent with a tiny maxReplicas, so the service saturates before it scales and thrashes between two values.
A PDB with
minAvailableequal to replicas, which blocks every drain and makes the node group upgrade fail with PodEvictionFailure.Running VPA in Recreate mode and an HPA on CPU for the same Deployment, so they fight.
Granting developers
cluster-adminin production because a Role took too long to write; RBAC has no deny, so it cannot be narrowed later without removing the binding.
Practice
On kind, deploy a pod with a 200m CPU limit running a busy loop and watch
container_cpu_cfs_throttled_periods_total(orcat /sys/fs/cgroup/cpu.statin the container); remove the limit and compare the time a fixed amount of work takes.Install metrics-server, create the HPA from this lesson at target 60 and generate load with a busybox loop; record replicas every 15 s during the ramp and for 10 minutes after you stop load, and compare with the simulation.
Create a Deployment with 3 replicas and a PDB with
minAvailable: 3, runkubectl drainon the node and watch it block; change the PDB tomaxUnavailable: 1and watch it complete.Label a namespace with
pod-security.kubernetes.io/enforce=restricted, try to create a pod that runs as root, read the rejection, then fix the pod spec (runAsNonRoot, drop ALL capabilities, seccompProfile RuntimeDefault) until it is admitted.
Interview questions (10)
1.Should you set CPU limits on your containers? Argue both sides.Hard
Against: a CPU request already becomes a cgroup weight that guarantees the pod its share under contention, and a limit adds a CFS quota that pauses the container for the rest of each 100 ms period once it uses its slice, even on an idle node. That throttling shows up as p99 latency that is hard to attribute, and in a Guaranteed pod it caps the pod at exactly its request. For: without limits a runaway pod can use all idle CPU and make utilisation metrics meaningless, and in multi-tenant or batch clusters a hard cap is fair. My default is CPU requests from measurement and no CPU limits for latency-sensitive services, limits for batch and untrusted workloads, and alerting on container_cpu_cfs_throttled_periods_total wherever limits exist. Memory is the opposite: always set a limit, equal to the request.
2.A pod is OOMKilled but the node shows plenty of free memory. Why, and what do you do?Medium
OOMKilled with exit code 137 is the container's own memory limit, enforced per cgroup; the node's free memory is irrelevant. I confirm with kubectl describe pod, last state OOMKilled, and look at the container's memory usage over the last day in Prometheus against the limit. If usage climbs steadily until the kill, it is a leak and the fix is in the application, with the limit raised only to buy time. If usage spikes at a known time, the limit was sized from the average and I raise it to the p99 plus headroom and set the request equal to it. If the kill happens with usage below the limit, it is not OOMKilled but node-pressure eviction, which has a different event and a different fix: requests that reflect real usage.
3.Explain how the HPA decides the replica count and why it scales down slowly.Medium
Every 15 seconds it reads the metric for the pods, for CPU the usage as a percentage of each pod's request, averages it, and computes desired replicas as ceil of current replicas times current over target. If the ratio is within 10 percent of 1 it does nothing. Scaling up is immediate, limited by the policy of at most 4 pods or double per 15 seconds. Scaling down uses a 300-second stabilisation window: it keeps every recommendation from the last five minutes and applies the highest, so a short dip does not remove capacity that a spike a minute later needs. You tune that with behavior.scaleDown.stabilizationWindowSeconds and percent-per-period policies. Pods that are not ready or have no metrics are treated conservatively so they do not cause over-reaction.
4.How do Karpenter and the Cluster Autoscaler differ, and when would you choose each?Medium
The Cluster Autoscaler works through node groups: when pods are Pending it picks a group whose instance type fits and increases the Auto Scaling group, and it removes nodes that stay under 50 percent requested for 10 minutes. You must predefine groups per instance type and zone. Karpenter has no groups: a NodePool lists allowed families, sizes, architectures and capacity types, and for each batch of Pending pods it computes the cheapest instance that fits and launches it directly, with spot fallback and interruption handling built in. Its consolidation replaces underused nodes with fewer or cheaper ones under disruption budgets you set. On EKS I choose Karpenter for general workloads because of speed and cost; the Cluster Autoscaler still fits where a team needs fixed, predictable node groups or runs outside AWS.
5.A developer asks why they cannot delete a Secret in their namespace. How do you find out?Easy
I run kubectl auth can-i delete secrets -n their-namespace --as their-user and, if they are in groups, --as-group as well, which asks the API server the exact question without guessing. If it says no, kubectl auth can-i --list -n ns --as user shows what they can do, and I look at the RoleBindings in the namespace and the ClusterRoleBindings for their groups to see which Role is missing the verb. RBAC is additive, so I add a Role with delete on secrets and bind it to their group, not their username. On EKS I also check the access entry that maps their IAM principal to Kubernetes groups, because that is where the group name comes from.
6.Walk me through upgrading a production EKS cluster from one minor version to the next.Hard
First, check the deprecated API list for the target minor and the apiserver_requested_deprecated_apis metric so nothing we apply will be rejected afterwards. Second, confirm add-on compatibility: VPC CNI, CoreDNS, kube-proxy, EBS CSI, the load balancer controller and Karpenter each have a supported range per Kubernetes minor. Third, check every PDB can allow at least one disruption, because the node upgrade drains through the Eviction API and fails with PodEvictionFailure after 15 minutes otherwise. Then the order the skew policy requires: control plane, then add-ons, then nodes, either a managed node group surge upgrade with maxUnavailable tuned, or with Karpenter a new AMI that drifts nodes in under the disruption budget. I do it in staging first with the same PDBs, one minor at a time, and keep the cluster inside EKS standard support, which is 14 months per minor.
7.Why can a readiness probe that checks the database cause a bigger outage?Medium
When the database slows down, every pod's readiness probe fails at the same time, the EndpointSlice empties, and the Service has no backends, so every request fails, including the ones that did not need the database, like health pages, cached reads or static content. The failure of one dependency became a total outage of the service. Readiness should answer "can this pod serve requests", and for a dependency the pod cannot work without, it is better to stay ready and return a fast 503 for the affected paths, so load balancers and callers see a degraded service instead of a vanished one. Liveness must never check a dependency at all, because restarting the pod does not fix the database.
8.What are Pod Security Standards and how do you roll them out without breaking workloads?Medium
They are three levels: privileged allows anything, baseline blocks the known escalations like host namespaces, privileged containers and hostPath, and restricted also requires non-root, dropped capabilities, a seccomp profile and no privilege escalation. They are applied with labels on a namespace in three modes: enforce rejects, warn returns a warning to whoever applies, and audit records the violation. The rollout is to label every namespace with warn=restricted and audit=restricted first, read the warnings and audit logs for a sprint, fix the workloads, then set enforce=baseline everywhere except kube-system, and move to enforce=restricted namespace by namespace. New namespaces get the labels from the namespace template or a Kyverno mutation.
9.What happens when you run kubectl drain, and what can block it?Easy
Drain cordons the node so no new pods are scheduled, then evicts every pod through the Eviction API, which checks PodDisruptionBudgets: an eviction that would break a budget is refused, and drain keeps retrying. DaemonSet pods are skipped with the ignore flag and pods with local emptyDir data need a delete flag. It gets stuck on a PDB that allows zero disruptions, for example minAvailable equal to the replica count or a single-replica Deployment with a PDB, and on bare pods not owned by a controller. The fix is never to delete pods by hand, which bypasses PDBs, but to fix the PDB or scale the Deployment so the budget can be met.
10.Explain QoS classes and how the kubelet chooses what to evict under memory pressure.Medium
Guaranteed means every container has CPU and memory requests equal to limits; Burstable means at least something is set; BestEffort means nothing is set. When memory.available on the node drops below the eviction threshold, 100Mi by default, the kubelet ranks pods: pods using more than their requests go first, ordered by priority class and by how far over they are, and Guaranteed pods plus Burstable pods under their requests go last. A BestEffort pod has requests of zero, so it is always over and always first. This is why setting memory requests from real usage protects a pod, and why a pod with a request far below its usage is the first casualty when a neighbour leaks.
Quiz
1.A container has requests cpu 500m, memory 512Mi and limits memory 512Mi, no CPU limit. What is its QoS class?
2.The HPA recommends 5 replicas but the Deployment stays at 15 for several minutes after traffic drops. Why?
3.A managed node group upgrade fails with PodEvictionFailure. What is the most likely cause?
4.Which upgrade order does the version skew policy require?
5.Which of these is NOT something RBAC can express?
Practice these problems
- DESIGNProduction EKS cluster for a 30-engineer startupHard
- DESIGNAutoscaling for a web app: ASG, HPA and cluster autoscalingMedium
- OPSPods Pending and ImagePullBackOff after a node group changeEasy
- OPSDeploy rolled out, users see errors, readiness probes flappingMedium
- OPSOOMKilled pods and an HPA that keeps scaling up and downMedium
Further reading
- Amazon EKS best practices guideGuidedocs.aws.amazon.com
- Karpenter documentationGuidekarpenter.sh
- Google Cloud: Kubernetes best practices: Resource requests and limitsArticlecloud.google.com
- Kubernetes Pod Security StandardsGuidekubernetes.io
- Autopilot: Workload Autoscaling at Google ScalePaperresearch.google
My notes
Your notes
Autosaves to this browser.