SRE practice - SLOs, error budgets, incidents and postmortems
Site Reliability Engineering is software engineering applied to running services. Its tools are the SLI (what you measure), the SLO (the target), the error budget (how much failure you can afford), burn-rate alerts (how fast you are spending it), a practised incident response with named roles, and blameless postmortems that turn each outage into action items. This lesson gives the definitions, the arithmetic and the checklists interviewers ask for.
Why it matters
"What is an SLO, and what is the difference from an SLA" opens most SRE interviews. The follow-ups are numeric: how many minutes is 99.9 percent, what does a burn rate of 14.4 mean, why page on burn rate instead of on error count. Then come the scenario questions: you are paged at 2 a.m., what are your first five minutes; how do you run a postmortem without blame. The same material is what separates a team that ships calmly from one that is always on fire, and it is the language of every reliability conversation in a platform job.
Read first: DevOps, SRE and platform engineering - how software reaches production, Observability - Prometheus, Grafana, OpenTelemetry, logs and alerting, Deployment strategies and release engineering
Lesson
What SRE is
SRE is what happens when you treat operations as a software problem. The team that keeps a service up has a budget for manual work, writes code to remove it, and measures reliability as a number negotiated with product teams rather than a feeling. Three ideas carry the practice: measure the user's experience (SLIs and SLOs), spend the allowed failure deliberately (error budgets), and learn from every incident without blame (postmortems).
Toil is operations work that is manual, repetitive, automatable, tactical, without lasting value, and that grows with the service: restarting pods by hand, rotating a certificate by ticket, approving the same quota request weekly. The SRE book's rule is to keep toil below 50 percent of each engineer's time; the rest goes into engineering that removes toil. A team over the line stops taking on new services until it is back under.
SLI, SLO, SLA
The SLA is always looser than the internal SLO, so you notice and fix a problem before it costs money. Four kinds of SLI cover most services:
- Availability: good = request got a successful response.
sum(rate(http_requests_total{status!~"5.."}[5m])) / sum(rate(http_requests_total[5m])). - Latency: good = request finished within a threshold. From a histogram:
rate(http_request_duration_seconds_bucket{le="0.3"}[5m]) / rate(http_request_duration_seconds_count[5m]). Note this is a ratio, not a percentile: "99 percent of requests under 300 ms" is an SLO you can budget; "p99 under 300 ms" is not. - Correctness: good = response had the right content (a canary query with a known answer, a checksum on a batch output).
- Freshness: good = data served was updated within N minutes (a search index, a recommendation table, a replica).
How to pick one: measure where the user is, not where it is convenient. Count at the load balancer or in a probe from outside, not inside the pod, because a dead pod reports nothing. Count what users do, not what the system does: "checkout requests good" beats "CPU under 80 percent". Keep two or three SLIs per service; more and nobody can say what it promises.
The error budget
The error budget is 1 - SLO: the fraction of events you are allowed to fail. At 99.9 percent, 0.1 percent of requests may fail, which at 10 million requests a day over 30 days is 300,000 requests. In time, if every failure were a full outage, 0.1 percent of 30 days is 43.2 minutes a month.
Each extra nine costs roughly ten times more engineering, and no user notices the difference between 99.99 and 99.999 on a mobile network that is itself at 99 percent. Pick the lowest SLO that keeps users happy; the budget is for spending on releases, migrations and experiments.
The error budget policy is the written agreement about what happens as the budget is spent. A usual one: above 50 percent left, ship freely; under 50 percent, risky changes need a reviewer; at zero, feature releases stop and the team works only on reliability until the rolling window recovers; and the policy names who can override it (a director, in writing). Without the policy, the budget is a dashboard nobody acts on.
Burn rate and multi-window alerts
Burn rate is how fast you are spending the budget relative to the pace that would spend it exactly at the end of the window. For a 99.9 percent SLO the allowed error rate is 0.1 percent; an error rate of 0.1 percent is burn rate 1 (budget gone in 30 days), 1 percent is burn rate 10 (gone in 3 days), 100 percent is burn rate 1,000 (gone in 43 minutes).
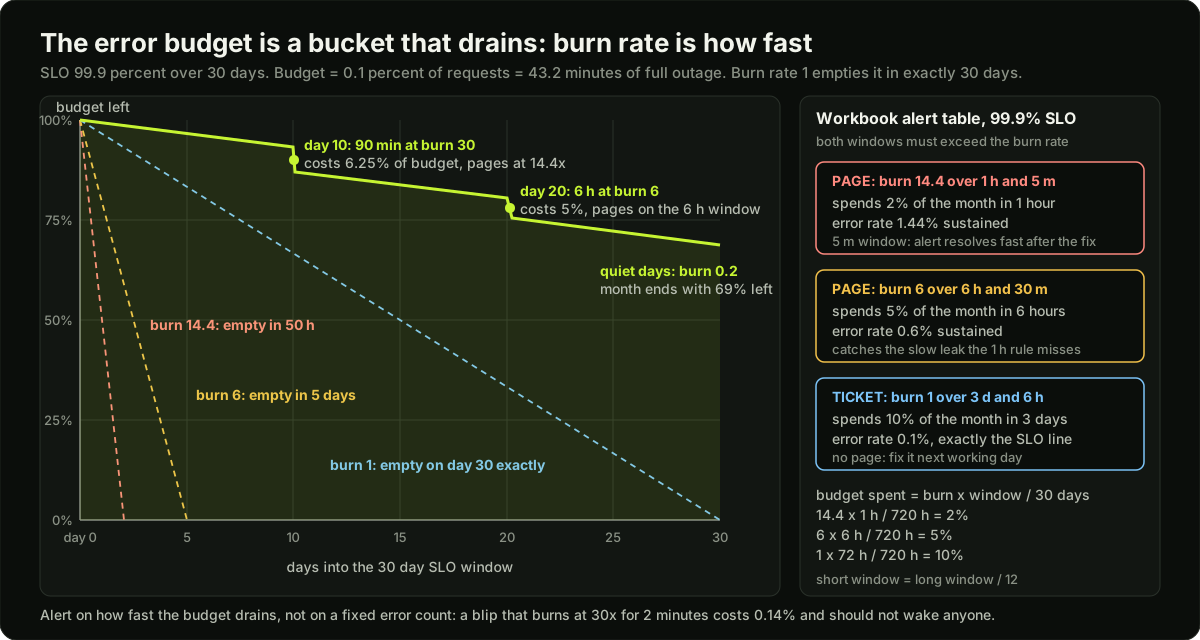 Chart of remaining error budget over a 30 day window with burn rate 1, 6 and 14.4 reference lines, two incidents draining it, and the SRE workbook alert table beside it
Alerting on burn rate instead of a raw error count makes every alert mean the same thing: "at this pace, how much of the month is this hour costing". The SRE workbook's recommended configuration for a 99.9 percent SLO over 30 days:
Two windows per rule, both of which must exceed the threshold. The long window gives precision: an hour at 14.4x is something real, not a 30 second blip. The short window gives a fast reset: without it, a one-hour alert keeps firing for up to an hour after the fix. The workbook's rule of thumb is short window = long window / 12. As Prometheus rules on recorded error ratios:
groups:
  - name: checkout-slo
    rules:
      - alert: CheckoutErrorBudgetBurn
        expr: |
          (
            service:http_errors:ratio_rate1h{service="checkout"} > (14.4 * 0.001)
            and
            service:http_errors:ratio_rate5m{service="checkout"} > (14.4 * 0.001)
          )
          or
          (
            service:http_errors:ratio_rate6h{service="checkout"} > (6 * 0.001)
            and
            service:http_errors:ratio_rate30m{service="checkout"} > (6 * 0.001)
          )
        labels:
          severity: page
        annotations:
          summary: "checkout is burning error budget at {{ $value | printf \"%.3f\" }} error ratio"
          runbook_url: https://runbooks.example.internal/checkout-slo-burn
      - alert: CheckoutErrorBudgetSlowBurn
        expr: |
          service:http_errors:ratio_rate3d{service="checkout"} > 0.001
          and
          service:http_errors:ratio_rate6h{service="checkout"} > 0.001
        labels:
          severity: ticket
Symptoms, not causes, and what makes a good alert
A symptom-based alert fires on what users feel: error ratio, latency, missing data. A cause-based alert fires on something that might lead to that: CPU at 90 percent, a disk at 80 percent, one pod restarting. Causes are many, change with the architecture, and often hurt nobody (a pod restarting behind a healthy Service). Symptoms are few, stable and always matter. Alert on symptoms; keep cause signals on the dashboard you open after the page.
Alert fatigue is when the on-call engineer ignores pages because most are noise, then misses the real one. The rules for a page: it is actionable (a human must do something now), urgent (it cannot wait until morning; otherwise it is a ticket), and it carries a runbook link and the labels needed to start (service, namespace, cluster). Review every page weekly: if it needed no action, delete or demote it. A healthy rotation sees a few pages a week, not a few per night.
Capacity planning and load testing
Capacity planning answers "will we survive the festival sale". Start from the demand forecast (peak requests per second, often 3 to 5 times the daily average around Indian sale events), measure what one replica handles at the latency SLO (not at 100 percent CPU), and add headroom for one zone failing (N+1 across 3 AZs means running at most 66 percent of total capacity). Load testing measures that per-replica number: k6 scripts in a CI job ramp to the target rate against a staging copy and fail the build if p95 crosses the SLO threshold. Test before the sale, and test the whole path including the database.
Incident response
An incident is any event where the SLO is in danger and more than one person must coordinate. Three things make it go well: a severity scale agreed in advance, named roles, and the habit of mitigating before understanding.
Roles, from the SRE book's incident management chapter: the incident commander holds the state of the incident, decides, delegates and keeps the live incident document; operations is the only group that changes the system; communications posts updates to stakeholders and the status page on a fixed cadence so engineers are not interrupted; planning files bugs, tracks every change for later revert and arranges handoffs. On a small team one person holds several roles, but the commander should not be the one typing commands.
The first five minutes after a page:
- Acknowledge the page so it does not escalate. Open the runbook linked in the alert.
- Confirm impact from the user's side: the SLO dashboard, the status of the external probe, the error ratio by route. Decide the severity.
- Say so: open the incident channel, post "investigating: checkout error ratio 8 percent since 02:10, impact: payments failing, IC: me". If SEV1 or SEV2, update the status page.
- Ask the question that resolves most incidents: what changed? Deploys in the last hour (
kubectl rollout history, the Argo CD timeline), config, feature flags, certificate expiries, a dependency's status page, traffic shape. - Mitigate first, understand later. If a deploy matches the timing, roll it back now and read the diff afterwards. Other standard mitigations: fail over to another region or replica, turn the feature flag off, scale up, shed load with a rate limit, drain a bad node. Root cause work happens after users are fine.
Then keep a timeline in the incident document: timestamp, who, what was observed or done. Memory of a 3 a.m. incident is gone by 9 a.m., and the timeline is the postmortem's raw material. Communications posts on a cadence ("next update in 30 minutes", and then at 30 minutes) using a template: what is affected, what users see, what we are doing, when the next update comes. Escalate when you are 15 minutes in with no idea, or the fix needs access you do not have; asking for help is not a failure, sitting alone is.
Postmortems
A postmortem is written for any incident that crossed a threshold: user-visible impact beyond a limit, data loss of any kind, on-call intervention such as a rollback, a long time to resolve, or a monitoring failure where a human found the problem before the alerts did. It is blameless: it looks for the conditions that let a reasonable person, acting on what they knew, cause or miss the problem, and never names an individual as the cause. Once people fear a postmortem they hide what happened, and the organisation stops learning.
The template:
Title: Checkout payments failing, 2026-10-14, SEV2
Owner: on-call SRE for checkout     Reviewers: checkout tech lead, payments SRE
Impact: 02:10 to 02:31 IST, 21 min. 8 percent of checkout requests returned 500,
        about 11,700 failed payments, 3.9 percent of the monthly error budget.
Detection: burn-rate page at 02:14, 4 min after impact. No customer tickets first.
Timeline:
  02:06  checkout v2.31 rolled out via Argo CD auto-sync
  02:10  error ratio rises from 0.1 to 8 percent on POST /pay
  02:14  page: CheckoutErrorBudgetBurn, 1h and 5m windows at 14.4x
  02:16  on-call acknowledges, opens incident channel, IC assigned
  02:21  what changed: v2.31 is the only change in 6 hours
  02:24  rollback to v2.30 started
  02:31  error ratio back to 0.1 percent; status page updated
  02:58  stable for 25 minutes; incident closed
Root cause: v2.31 cut the payments client timeout from 5 s to 500 ms; the provider's
        p99 is 800 ms, so 8 percent of calls timed out.
Contributing factors: timeout lives in a config file with no review; staging uses a
        mock provider with 10 ms latency; the canary stage was skipped.
What went well: page 4 min after impact; rollback took 7 min.
What went badly: 10 min from page to rollback start, spent reading logs, not asking what changed.
Where we got lucky: 02:00 is low traffic in India; at 20:00 the impact would be 10x.
Action items (owner, due, ticket):
  - Canary stage with a 10 min bake on the checkout rollout (platform, 2 weeks, PLAT-412)
  - Alert annotation links to the recent-changes dashboard (SRE, 1 week, SRE-88)
  - Staging mock replays the provider's real latency distribution (checkout, 3 weeks, CHK-901)
Five whys (ask why five times until you reach a process cause) is a useful warm-up and a poor final answer: it produces one straight line of causes, while real incidents have several interacting ones, and it stops wherever the asker gets tired. Write root cause and contributing factors, plural.
Two short readings every SRE should know. How Complex Systems Fail argues that complex systems always run with latent faults and partial failures, and that an accident needs several of them to line up, so there is never one root cause and the people operating the system are mostly its defence, not its weakness. Ironies of Automation observes that automating the normal case leaves the human with only the abnormal, rare cases, exactly when they are least practised, so automation must keep operators in the loop and make the system's state visible. Both are why "human error" is never an acceptable root cause.
On-call, runbooks, chaos and DORA
On-call is a rotation (one primary, one secondary, a week each, 6 to 8 people so each is on about one week in two months), a documented handoff at the boundary (open incidents, silences, known risks, what changed this week), paging rules (what pages, what tickets), and compensation: time off or pay for the hours, and a cap on pages per shift above which the rotation itself is a bug. A rotation under 4 people burns out.
A runbook is the page the alert links to. Structure: what the alert means in one sentence, two queries to confirm impact, the three most likely causes with the command that checks each, the mitigation for each with the exact command (kubectl rollout undo deployment/checkout -n shop, the flag name to flip), when to escalate and to whom, and the date it was last tested. Write it the week you create the alert; one written during the incident is too late.
Chaos engineering, as the Chaos Engineering paper describes it, is running controlled experiments to find weaknesses before they find you: define steady state (the SLI), form a hypothesis ("losing one AZ keeps availability above 99.9 percent"), inject the failure with a small blast radius, watch the SLI, and stop the moment it degrades. A game day is the rehearsal: the team plays through an incident (a region loss, an expired certificate, a full disk) with the real on-call tooling and timeline, then writes the same postmortem it would after a real one. Tools: Chaos Mesh or LitmusChaos on Kubernetes, AWS Fault Injection Service for the cloud layer.
The DORA metrics are the delivery-side counterpart of SLOs: deployment frequency and change lead time (throughput), change fail rate and failed deployment recovery time (stability), plus deployment rework rate in the current five-metric model. A slow rollback shows up as a bad recovery time and as a drained error budget; small, frequent, reversible deploys with canaries fix both.
Diagram
Worked example
The service. Checkout handles 10 million requests a day and promises 99.9 percent availability over a rolling 30 days.
Step 1: the budget in requests. Requests in the window: 10,000,000 x 30 = 300,000,000. Error budget = (1 - 0.999) x 300,000,000 = 300,000 failed requests a month.
Step 2: the budget in minutes. If failures came as full outages, the budget is 0.001 x 30 days x 24 x 60 = 43.2 minutes of downtime a month. Compare: 99.99 percent would be 4.3 minutes, which no rollback in Kubernetes can meet without automation that triggers in under a minute.
Step 3: a 1-hour burn at 14.4x. Burn rate 14.4 means an error rate of 14.4 x 0.1 percent = 1.44 percent. Requests per hour: 10,000,000 / 24 = 416,667. Errors in that hour: 416,667 x 0.0144 = 6,000. Fraction of the monthly budget: 6,000 / 300,000 = 2 percent. The same answer from the formula: 14.4 x 1 hour / 720 hours = 0.02. That is exactly the workbook's first row: the 1-hour page fires when one hour has cost 2 percent of the month, and the 5-minute window must agree so it resets quickly after the fix. At this pace the whole budget is gone in 720 / 14.4 = 50 hours, which is why it is a page and not a ticket.
Step 4: the other two rows. 6x over 6 hours: 6 x 6 / 720 = 5 percent of the budget, gone in 5 days. 1x over 3 days: 1 x 72 / 720 = 10 percent, and at burn rate 1 the budget lasts the whole 30 days, which is exactly on the SLO line: not urgent, hence a ticket.
Step 5: a real incident. A bad deploy pushes the error rate to 3 percent (burn rate 30) for 90 minutes. Budget spent: 30 x 1.5 / 720 = 6.25 percent, or 18,750 failed requests out of 300,000. The 1-hour window crosses 14.4 after 14.4 / 30 of an hour, about 29 minutes, so the page arrives then (the code example shows 28 minutes on generated data). A 5-minute-only alert would page at minute 1 but also on every 5-minute blip; the two-window rule trades 28 minutes of detection time for a quiet pager. After the rollback, the 5-minute window drops under threshold within minutes and the alert resolves, while the 1-hour average alone would have stayed above 14.4 for most of an hour.
Runnable code
"""SLO, error budget and multi-window multi-burn-rate alerts, the SRE workbook way.

Input: one row per minute of (good, total) request counts, generated with a fixed
seed: three quiet days so every window is full, then an incident that pushes the
error rate from 0.02 percent to 3 percent for 90 minutes.

The script computes, every minute:
  - the SLI so far (good / total)
  - the error budget left for the 30 day window
  - the burn rate over 5m, 1h, 6h and 3d windows
and fires alerts exactly as the workbook's table for a 99.9 percent SLO says:
  page   if burn >= 14.4 over 1h  AND burn >= 14.4 over 5m   (2 percent of budget in 1h)
  page   if burn >= 6    over 6h  AND burn >= 6    over 30m  (5 percent of budget in 6h)
  ticket if burn >= 1    over 3d  AND burn >= 1    over 6h   (10 percent of budget in 3d)
No network, standard library only.
"""
import random

SLO = 0.999
ERROR_BUDGET_FRACTION = 1 - SLO          # 0.001: the allowed error rate
PERIOD_MIN = 30 * 24 * 60                # 30 day SLO window in minutes
REQ_PER_MIN = 7000                       # about 10 million requests a day

# (name, long window, short window, burn-rate threshold, severity), from the workbook
RULES = [
    ("page_fast", 60, 5, 14.4, "page"),
    ("page_slow", 6 * 60, 30, 6.0, "page"),
    ("ticket", 3 * 24 * 60, 6 * 60, 1.0, "ticket"),
]


def generate(minutes, incident_start, incident_len, seed=42):
    """Per-minute (good, total) counts: about 7,000 requests a minute, 0.02 percent errors,
    rising to 3 percent during the incident."""
    rng = random.Random(seed)
    rows = []
    for m in range(minutes):
        total = rng.randint(REQ_PER_MIN - 500, REQ_PER_MIN + 500)
        err_rate = 0.03 if incident_start <= m < incident_start + incident_len else 0.0002
        bad = rng.binomialvariate(total, err_rate)   # Python 3.12+
        rows.append((total - bad, total))
    return rows


def burn_rate(rows, end, window):
    """Error rate over the last `window` minutes, divided by the error rate the SLO allows.
    A burn rate of 1 spends the whole budget in exactly the SLO period."""
    start = max(0, end - window + 1)
    good = sum(g for g, _ in rows[start:end + 1])
    total = sum(t for _, t in rows[start:end + 1])
    if total == 0:
        return 0.0
    return (1 - good / total) / ERROR_BUDGET_FRACTION


def budget_consumed_by(burn, window_min):
    """Fraction of the 30 day budget a given burn rate eats in `window_min` minutes."""
    return burn * window_min / PERIOD_MIN


def run(rows, print_from=0, verbose=True):
    good_so_far = total_so_far = 0
    # the whole run is the start of a 30 day window; the budget is 0.1 percent of the
    # requests expected in that window
    budget_errors = REQ_PER_MIN * PERIOD_MIN * ERROR_BUDGET_FRACTION
    state = {name: False for name, *_ in RULES}
    events = []
    for m, (g, t) in enumerate(rows):
        good_so_far += g
        total_so_far += t
        sli = good_so_far / total_so_far
        remaining = 1 - (total_so_far - good_so_far) / budget_errors
        burns = {w: burn_rate(rows, m, w) for w in (5, 30, 60, 360, 3 * 24 * 60)}
        for name, long_w, short_w, threshold, severity in RULES:
            firing = burns[long_w] >= threshold and burns[short_w] >= threshold
            if firing != state[name]:
                state[name] = firing
                events.append((m, name, "FIRING" if firing else "resolved"))
                if verbose:
                    print(f"  t={m - print_from:5d} min  {severity:6s} {name:9s} {'FIRING' if firing else 'resolved':8s} "
                          f"burn 5m={burns[5]:5.1f} 1h={burns[60]:5.1f} 6h={burns[360]:5.1f} "
                          f"3d={burns[4320]:5.2f}  SLI={sli:.5f}  budget left={remaining:6.1%}")
        if verbose and m >= print_from and (m - print_from) % 60 == 0 and m - print_from <= 300:
            print(f"  t={m - print_from:5d} min  hourly  SLI={sli:.5f}  budget left={remaining:6.1%}  "
                  f"burn 5m={burns[5]:5.1f} 1h={burns[60]:5.1f} 6h={burns[360]:5.1f} 3d={burns[4320]:5.2f}")
    return events, sli, remaining


if __name__ == "__main__":
    QUIET = 3 * 24 * 60                        # three quiet days so the 3d window is full
    INCIDENT_START, INCIDENT_LEN = QUIET + 180, 90   # day 4, starts at 3 h, lasts 90 min
    rows = generate(minutes=QUIET + 12 * 60, incident_start=INCIDENT_START, incident_len=INCIDENT_LEN)
    print("SLO 99.9 percent, error budget = 0.1 percent of requests over 30 days")
    print("the workbook table: page at 14.4x (1h and 5m), page at 6x (6h and 30m), ticket at 1x (3d and 6h)")
    print(f"budget consumed by each rule when it fires: "
          f"{budget_consumed_by(14.4, 60):.0%}, {budget_consumed_by(6, 360):.0%}, "
          f"{budget_consumed_by(1, 4320):.0%}\n")
    print(f"timeline of day 4 (incident injected at t=180 for {INCIDENT_LEN} min, 3 percent errors = burn rate 30):")
    events, sli, remaining = run(rows, print_from=QUIET)

    pages = [(m, n) for m, n, s in events if s == "FIRING" and n.startswith("page")]
    assert pages, "a page must fire during the incident"
    first_page = min(m for m, _ in pages)
    # at burn rate 30 the 1h window crosses 14.4 after 14.4 / 30 of an hour, about 29 min
    assert INCIDENT_START + 25 <= first_page <= INCIDENT_START + 35, f"first page at {first_page - QUIET}"
    assert not any(m < INCIDENT_START for m, _, _ in events), "nothing may fire before the incident"
    assert not any(n == "ticket" for _, n, _ in events), "a 90 min incident does not trip the 3 day ticket rule"
    resolved = [m for m, n, s in events if s == "resolved" and n == "page_fast"]
    assert resolved and resolved[0] <= INCIDENT_START + INCIDENT_LEN + 60, "the 1h page must resolve within an hour of the fix"

    # cross-check the arithmetic in the worked example
    assert abs(budget_consumed_by(14.4, 60) - 0.02) < 1e-9
    assert abs(budget_consumed_by(6, 360) - 0.05) < 1e-9
    assert abs(budget_consumed_by(1, 4320) - 0.10) < 1e-9

    print(f"\nafter 3.5 days: SLI={sli:.5f}, error budget left={remaining:.1%} "
          f"(90 min at burn rate 30 cost 90 x 30 / 43,200 = 6.25 percent of the month's budget)")
    print(f"first page {first_page - INCIDENT_START} min after the incident began; "
          f"a 5m-only alert would have paged in 1 min but also on every 5 min blip")
    print("all checks passed")
Key takeaways
An SLI is good events over total events measured where the user is; an SLO is the target over a window; an SLA is the contract with penalties, always looser than the SLO.
The error budget is 1 minus the SLO: 99.9 percent is 43.2 minutes a month, and it is there to be spent on change.
Burn rate = error rate / (1 - SLO). Budget spent = burn rate x window / period. The workbook pages at 14.4x over 1h and 5m, 6x over 6h and 30m, and tickets at 1x over 3d and 6h.
Two windows per alert: the long one for precision, the short one so the alert resets minutes after the fix.
Page on symptoms users feel; put causes on the dashboard. Every page must be actionable, urgent and link to a runbook.
Incident response: acknowledge, confirm impact, declare severity, ask what changed, mitigate first (rollback, failover, flag off, scale), understand later. Keep a timeline.
Postmortems are blameless, list root cause and contributing factors, and end in action items with owners and dates; an unreviewed postmortem might as well not exist.
On-call needs 6 to 8 people, documented handoffs, compensation and a weekly review that deletes noisy alerts; runbooks are written when the alert is, not during the outage.
Common mistakes
Setting an SLO of 99.99 percent because it sounds good, then having a 4-minute monthly budget no rollback can meet.
Measuring the SLI inside the pod, so a dead pod or a broken load balancer reports no errors and the SLO looks perfect during a full outage.
Alerting on CPU, memory or pod restarts and paging people for things no user noticed, until the one page that matters is ignored.
Spending the first 20 minutes of an incident reading logs instead of asking what changed and rolling it back.
Writing "human error" or one person's name as the root cause, which ends learning and makes the next incident more likely to be hidden.
Action items with no owner or date, which is the same as no action items.
Practice
On a kind cluster with kube-prometheus-stack, deploy a small HTTP app with a
/payroute that fails a configurable percentage of requests. Write recording rules for the 5m, 30m, 1h and 6h error ratios and the two workbook page rules. Set the failure rate to 3 percent and time how long until the 1h/5m rule fires; then set it back to 0 and time the reset.Compute, by hand and then with the code example, the error budget in requests and minutes for your app at 99.5 and 99.95 percent, and the burn rate thresholds that keep the same 2, 5 and 10 percent budget consumption per window.
Run a game day with a friend: one of you breaks the app (expire a certificate, delete the Service, set a 100 ms timeout on a 500 ms dependency) while the other responds using only the runbook and a timeline document. Write the postmortem with the template from this lesson and at least three action items with owners.
Write a one-page runbook for the burn-rate alert, including the exact
kubectl rollout undoandkubectl scalecommands, and test it by following it word for word during the next game day.
Interview questions (12)
1.Explain SLI, SLO and SLA with an example.Easy
An SLI is a measurement of one aspect of quality, expressed as a ratio of good events to total events: for checkout, the fraction of requests that got a non-5xx response within 300 ms. The SLO is the target for that SLI over a window: 99.9 percent over a rolling 30 days. The SLA is the contract with a customer that attaches consequences, such as a 10 percent credit if monthly availability falls below 99.5 percent. The SLA is always looser than the SLO, so the team sees and fixes a problem before it costs money. The error budget, 0.1 percent here, is what the SLO leaves for change.
2.What does 99.9 percent availability mean in minutes, and why not promise 99.99?Easy
Over 30 days, 0.1 percent is 43.2 minutes of full outage, or 300,000 failed requests at 10 million a day. 99.99 percent is 4.3 minutes a month. A Kubernetes rollback takes a few minutes after a human notices, so 99.99 needs automated detection and rollback in under a minute, multi-region failover, and no single dependency below that level. Each extra nine costs roughly ten times more, and a user on a mobile network that is itself around 99 percent cannot tell the difference. Pick the lowest SLO that keeps users happy and spend the budget on shipping.
3.What is a burn rate and why alert on it instead of on an error count?Medium
Burn rate is the current error rate divided by the error rate the SLO allows. At 99.9 percent, a 0.1 percent error rate is burn rate 1 and spends the budget in exactly 30 days; 1.44 percent is 14.4 and spends 2 percent of the month in one hour. Alerting on burn rate makes every alert mean the same thing for every service: "at this pace, this much of the month is being spent", regardless of traffic volume. An error count threshold means something different at 10 requests a second and 10,000, and has to be retuned every time traffic grows.
4.Describe the multi-window multi-burn-rate alert from the SRE workbook.Hard
For a 99.9 percent SLO over 30 days there are three rules. Page when the burn rate is above 14.4 over both the last hour and the last 5 minutes, which means one hour has consumed 2 percent of the budget. Page when it is above 6 over both 6 hours and 30 minutes, which is 5 percent in 6 hours and catches a slower leak. Ticket when it is above 1 over both 3 days and 6 hours, which is 10 percent in 3 days and exactly on the SLO line, so it can wait for working hours. The long window gives precision: an hour at 14.4x is real, not a blip. The short window, about a twelfth of the long one, gives a fast reset: once the fix lands, the 5-minute rate drops and the alert stops, instead of firing for the rest of the hour.
5.Why are symptom-based alerts better than cause-based alerts?Medium
A symptom is what the user feels: error ratio, latency, stale data. A cause is a possible reason: high CPU, a pod restarting, a disk filling. Causes are many, change every time the architecture changes, and often hurt nobody; a pod restarting behind a healthy Service is not an incident. Symptoms are few, stable and always matter. So the page is on the SLI, and the cause signals live on the dashboard you open after the page. The exception is a cause that will become a symptom with certainty and needs lead time, such as a certificate expiring in 7 days or a disk that will fill in 4 hours; those are tickets with a deadline, not pages at 3 a.m.
6.You are paged at 2 a.m. for a checkout error ratio of 8 percent. What are your first five minutes?Medium
Acknowledge the page and open the runbook. Confirm impact from the user side: the SLO dashboard, the external probe, the error ratio by route; that sets the severity. Say what I see in the incident channel with myself as incident commander, and update the status page if it is customer-facing. Then ask what changed in the last hour: deploys, config, flags, certificates, a dependency's status page. If a deploy matches the timing, I roll back immediately with kubectl rollout undo or Argo CD, without reading the diff first. If not, I try the other mitigations: failover, flag off, scale up, rate limit. I keep a timestamped timeline from the first minute and escalate if I am 15 minutes in with no idea.
7.What is "mitigate first, understand later" and when is it wrong?Medium
During an incident the goal is to stop user impact, not to find the root cause. A rollback, failover, feature flag off or scale-up fixes most incidents in minutes, and the investigation can happen on the saved logs and traces afterwards. The exceptions: when the mitigation could destroy evidence or data, such as restarting the only node holding an unflushed queue, or when the "fix" would make it worse, such as scaling up a service that is overloading a shared database. In those cases the commander pauses for a minute to capture state (a heap dump, a snapshot) or picks a different mitigation. But the default is to act within minutes, not to debug.
8.What makes a postmortem blameless, and what goes in one?Medium
Blameless means the document looks for the conditions that let a reasonable person, acting on what they knew at the time, cause or miss the problem, and never names an individual as the cause. If people fear the postmortem they hide what happened, and the organisation stops learning. The content: impact with numbers and budget spent, how it was detected, a timestamped timeline, root cause and the contributing factors, what went well, what went badly, where we got lucky, and action items each with an owner, a due date and a ticket. It is reviewed by people outside the incident and shared widely; an unreviewed postmortem might as well not exist.
9.What is wrong with the five whys?Medium
It produces one straight line of causes and stops wherever the asker gets tired, often at "the engineer made a mistake". Real incidents in complex systems need several latent faults to line up: a short timeout, a staging mock with unrealistic latency, a skipped canary, low-traffic timing. How Complex Systems Fail makes the point that there is never a single root cause and that the humans operating the system are mostly its defence. So I use five whys as a warm-up and write the postmortem with root cause and contributing factors, plural, and action items against several of them.
10.How do you run on-call so people do not burn out?Easy
A rotation of 6 to 8 engineers with a primary and a secondary, a week at a time, so each person is on about one week in two months. A documented handoff at each boundary: open incidents, active silences, known risks, what shipped this week. Paging rules that send only actionable, urgent, symptom-based alerts to the pager and everything else to a ticket queue. A weekly review of every page that deletes or demotes the ones that needed no action. Compensation in time off or pay, and a cap on pages per shift above which the rotation itself is treated as a bug. A rotation under 4 people is not sustainable.
11.What is a runbook and what must it contain?Easy
The page an alert links to, written when the alert is created, not during the outage. It has one sentence on what the alert means, two queries to confirm impact, the three most likely causes with the command that checks each, the exact mitigation for each cause such as kubectl rollout undo deployment/checkout -n shop or the flag to flip, when and to whom to escalate, and the date it was last tested in a game day. A runbook that says "investigate the logs" is not a runbook. Good ones are short enough to follow at 3 a.m. with one eye open.
12.What is chaos engineering and how would you start?Medium
It is running controlled experiments against the real system to find weaknesses before an incident does. You define steady state as an SLI, state a hypothesis such as "losing one availability zone keeps checkout availability above 99.9 percent", inject that failure with the smallest blast radius that still tests it, watch the SLI, and stop the moment it degrades. I would start with a game day in staging: kill a pod, then a node, then block a dependency with a NetworkPolicy, using Chaos Mesh or LitmusChaos, with the real on-call tooling and a postmortem afterwards. Only once those pass and the rollback path is automatic would I run a small experiment in production during low traffic, with a kill switch.
Quiz
1.A service has a 99.9 percent availability SLO over 30 days. How much full downtime does the error budget allow per month?
2.With a 99.9 percent SLO, what error rate is a burn rate of 14.4?
3.In the workbook's page rule, why is a 5 minute window combined with the 1 hour window?
4.Which of these is a symptom-based alert?
5.During a SEV1, a deploy went out 4 minutes before the errors started. What do you do first?
6.Which statement about a blameless postmortem is correct?
Practice these problems
- DESIGNObservability platform for 200 microservicesHard
- DESIGNSLO-based alerting and on-call systemMedium
- DESIGNUptime monitoring service with global probes and alertingMedium
- OPSTLS certificate expired in productionEasy
- CODEPython: concurrent health checker with retries and backoffMedium
- CODEPython: SLO error budget and burn-rate alert calculatorEasy
Further reading
- Google SRE Workbook: Chapter 5 - Alerting on SLOsArticlesre.google
- Google SRE Book: Chapter 4 - Service Level ObjectivesArticlesre.google
- Google SRE Book: Chapter 15 - Postmortem Culture: Learning from FailureArticlesre.google
- How Complex Systems FailPaperhow.complexsystems.fail
- Chaos EngineeringPaperarxiv.org
My notes
Your notes
Autosaves to this browser.