Troubleshooting playbook - Linux, Docker, Kubernetes, network, pipelines
Troubleshooting is a method, not a list of commands. Scope the damage, protect users before you understand the cause, follow the request path to the first broken contract, test one hypothesis with one command, change one thing at a time, and write down what you did. This lesson gives that method and then five dense playbooks (Linux host, containers, Kubernetes, networking, pipelines) where every row has a symptom, likely causes, a real first command, the evidence that confirms it, and the fix.
Why it matters
Every DevOps and SRE interview has a "something is broken, what do you do" round, and the interviewer is not scoring whether you know the answer. They are scoring whether you ask who is affected before touching anything, whether you roll back before you debug, whether your next command follows from the last output, and whether you can say "I would check X because Y" instead of "I would restart it". The same habits decide whether a real 02:00 page lasts ten minutes or three hours. Candidates from service companies are asked the Kubernetes rows of this lesson directly: CrashLoopBackOff, ImagePullBackOff, Pending, a Service with no endpoints.
Read first: Linux for operators, Networking for DevOps - TCP/IP, DNS, HTTP, TLS, SSH, Containers and Docker, Kubernetes networking and storage, Kubernetes in production - resources, autoscaling, RBAC, upgrades, EKS, Observability - Prometheus, Grafana, OpenTelemetry, logs and alerting
Lesson
The method: six moves, in order
- Scope the impact. Who, how many, since when, getting worse? One dashboard answers this: error rate and latency per service, split by region and version. "Since when" is the most useful fact you will get, because it narrows "what changed" to a window.
- Protect users before you diagnose. If a rollback, failover, scale-up or feature flag can stop the bleeding, do it now and study the broken version afterwards with no traffic on it. A rollback that does not help is evidence too.
- Follow the request path to the first broken contract. Every hop promises something to the next: DNS returns an IP, the load balancer has healthy targets, the Service has endpoints, the pod is Ready, the app returns 200, the database accepts connections. Stop at the first hop that breaks its promise. Everything after it is a symptom.
- One hypothesis, one command. "The pod is not Ready because the readiness path needs the database and the database is full." Test:
kubectl describe podshows the probe failing with that error. A hypothesis you cannot test with a command is a guess. - Change one thing at a time, with a five-minute timer; if the change has not helped, undo it.
- Write it down as you go. Timestamps, commands, outputs, decisions. This becomes the incident note.
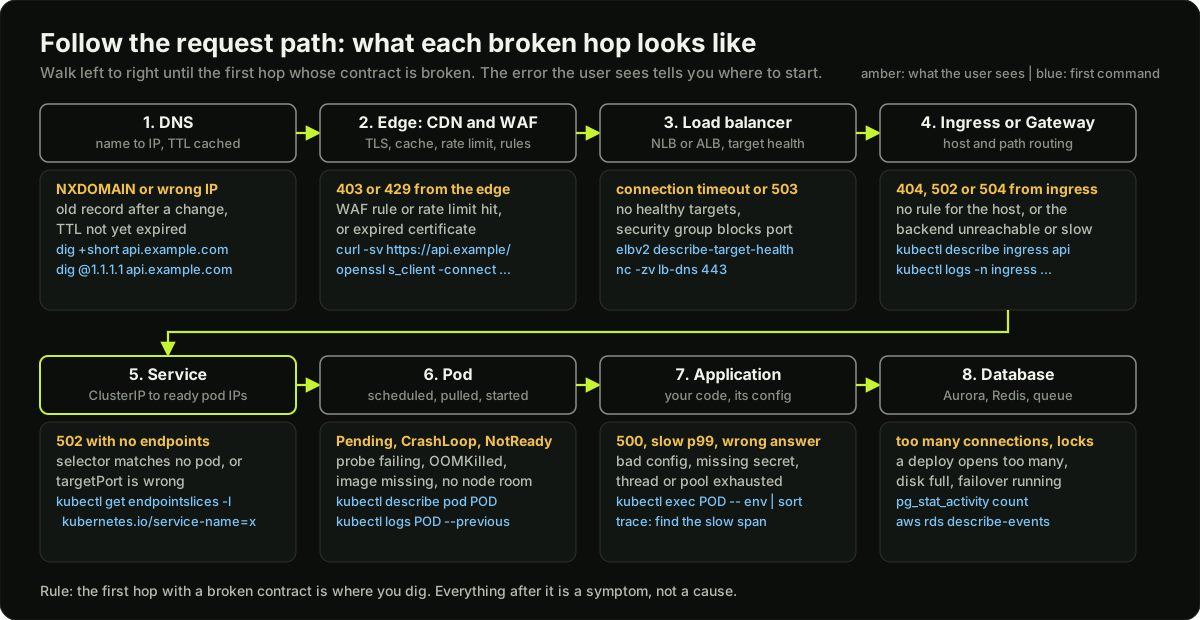 The request path from DNS through edge, load balancer, ingress, Service, pod and application to the database, with what the user sees and the first command to run when each hop is broken
Two triage frames: USE for resources, RED for services
USE is for resources (CPU, memory, disk, network, pools): Utilization (how busy), Saturation (how much work is queued), Errors. A CPU at 70 percent with a run queue of 40 is saturated. RED is for services: Rate, Errors, Duration (p50 and p99). Run RED along the request path; the first hop whose errors or duration jumped is the suspect. Run USE on that hop's host to see what it ran out of.
The Kubernetes loop: describe, logs, previous, events, exec
P=api-7d9f6b7c5-x2k4p
kubectl describe pod $P -n shop                    # state, last state, restarts, probes, Events at the bottom
kubectl logs $P -n shop -c api --tail=200          # what the app said
kubectl logs $P -n shop -c api --previous          # the container that crashed; the current one may be silent
kubectl get events -n shop --sort-by=.metadata.creationTimestamp   # what the cluster did, in time order
kubectl events -n shop --for pod/$P --types=Warning                # newer form: one object, warnings only
kubectl exec -it $P -n shop -c api -- sh -c 'env | sort; wget -qO- localhost:8080/healthz'
kubectl get pod $P -n shop -o jsonpath='{.status.containerStatuses[0].lastState.terminated.exitCode}{"\n"}'
kubectl debug and ephemeral containers. Production images are distroless, so exec finds no shell. An ephemeral container is a temporary container added to a running pod. It shares the pod's network namespace, and with --target the app's process namespace, so a toolbox image sees the app's processes and sockets.
# add a debug container; --target shares the app's process namespace (ps, netstat -tlnp, wget localhost)
kubectl debug -it $P -n shop --image=busybox:1.36 --target=api -- sh
# a pod that crashes before you can attach: copy it with a shell as the command, same env and mounts
kubectl debug $P -n shop -it --copy-to=api-dbg --container=api -- sh
# --profile=netadmin allows tcpdump; --profile=restricted passes a restricted Pod Security namespace
# a node problem: a pod on that node with the host filesystem at /host
kubectl debug node/ip-10-0-3-41.ap-south-1.compute.internal -it --image=busybox:1.36 -- chroot /host journalctl -u kubelet -n 100
kubectl delete pod api-dbg -n shop   # copies must be deleted by hand; ephemeral containers go with the pod
Playbook A: Linux host
Playbook B: containers
Exit codes above 128 are 128 plus the signal: 137 is SIGKILL (OOM or a hard kill), 143 is SIGTERM, 139 is SIGSEGV.
Playbook C: Kubernetes
Playbook D: networking
Refused: nothing listens. Timeout: something drops packets. Reset: a connection existed and someone closed it.
Playbook E: pipelines and deploys
Traces and metrics: finding the slow hop
Latency problems are not errors, so the path walk uses duration. In a slow OpenTelemetry trace, find the longest span with no long children: that span is doing the waiting. If it is SELECT ... FROM orders at 2 s with nothing beneath, the database is slow; if it is a client span waiting on inventory-svc, go there and repeat. A gap between a parent span and its first child is time spent in a queue or a connection pool. Without traces, the slow hop is the first whose p99 rose while its downstream did not.
Writing the incident note
Under ten lines, in this order: impact in numbers (who, how many, from when to when), what users saw, timeline of detection, mitigation and resolution, root cause in one sentence, the trigger, the fix, follow-ups with owners. It names services and commands, not people: the cause is a condition in the system, such as "the pipeline allowed a port change without a matching Service change".
Diagram
Worked example
A 502 storm after a deploy. At 14:02 Argo CD syncs checkout-api revision 31. At 14:05 the SLO alert fires: 5xx ratio 18 percent. Traffic is 12,000 requests per minute.
Step 1, scope. The error panel split by version shows all 5xx come from the ingress, and started at 14:02:40. One service, one region, every user who hits checkout. Since when: the deploy. That alone makes rollback the right first move.
Step 2, protect. kubectl rollout undo deployment/checkout-api -n shop at 14:08. The old ReplicaSet still exists, so the pods are Ready in 40 seconds. Errors fall to zero at 14:11. Nine minutes at 18 percent of 12,000 per minute is 12,000 x 9 x 0.18 = 19,440 failed requests. With a 99.9 percent monthly SLO on about 518 million requests (12,000 x 60 x 24 x 30), the monthly error budget is 518,400 requests, so this incident spent 19,440 / 518,400 = 3.75 percent of the budget.
Step 3, follow the path on the broken revision, kept running as a separate Deployment with no traffic. DNS, edge and load balancer are fine (the old version works through them). kubectl describe ingress checkout routes to Service checkout-api port 80. kubectl get endpointslices -l kubernetes.io/service-name=checkout-api lists the new pods, so the Service has endpoints and the pods are Ready. First broken contract must be after the Service: the controller log says connect() failed (111: Connection refused) while connecting to upstream 10.0.4.17:8080.
Step 4, hypothesis: the new image listens on a different port. One command: kubectl debug -it POD --image=busybox:1.36 --target=checkout -- netstat -tlnp. Output: 0.0.0.0:8081. Confirmed. The Service targetPort is 8080. The readiness probe was tcpSocket on 8081 inside the container, so the pods were Ready while the Service pointed at a closed port: refused, hence 502.
Step 5, one change: the port in the Deployment template back to 8080, through Git. Step 6, the note: impact 19,440 requests over 9 minutes; cause: port change in the app without a matching Service change; trigger: revision 31; fix: rollback then corrected port; follow-ups: a CI check that containerPort, targetPort and the readiness probe port agree, and an HTTP readiness probe instead of a TCP one.
Runnable code
"""A decision-tree diagnoser for Kubernetes pod states.

Give it a pod status in the same shape kubectl returns (phase, container
statuses with waiting reasons and last terminated exit codes, conditions,
events) and it walks the same tree an on-call engineer walks: Pending first,
then image problems, then crashes, then readiness, then 'healthy'. For each
pod it prints a diagnosis and the one command to run next. No cluster needed.
"""


def diagnose(pod):
    """Return (diagnosis, next_command) for one pod status dict."""
    name = pod["name"]
    phase = pod["phase"]
    statuses = pod.get("containerStatuses", [])
    conditions = {c["type"]: c for c in pod.get("conditions", [])}
    events = pod.get("events", [])
    reasons = [e["reason"] for e in events]

    # Branch 1: Pending means no node yet, or the node cannot start it.
    if phase == "Pending":
        sched = conditions.get("PodScheduled", {})
        if sched.get("status") == "False":
            msg = sched.get("message", "")
            if "Insufficient" in msg:
                return ("Pending: no node has room (" + msg + ")",
                        f"kubectl describe pod {name} | grep -A3 Events; kubectl top nodes")
            if "taint" in msg:
                return ("Pending: every node is tainted and the pod has no toleration",
                        "kubectl get nodes -o custom-columns=NAME:.metadata.name,TAINTS:.spec.taints")
            if "volume" in msg or "pvc" in msg.lower():
                return ("Pending: the PVC is not bound (missing StorageClass or zone mismatch)",
                        f"kubectl get pvc -n {pod['namespace']}; kubectl describe pvc")
            return ("Pending: unschedulable for another reason: " + msg,
                    f"kubectl describe pod {name}")
        for s in statuses:
            waiting = s.get("state", {}).get("waiting", {})
            if waiting.get("reason") in ("ImagePullBackOff", "ErrImagePull"):
                return ("Image pull failed: wrong name, tag, or missing registry credentials",
                        f"kubectl describe pod {name} | grep -iE 'pull|unauthorized|not found'")
            if waiting.get("reason") == "ContainerCreating":
                if "FailedMount" in reasons:
                    return ("Stuck in ContainerCreating: a volume, ConfigMap or Secret failed to mount",
                            f"kubectl get events --field-selector involvedObject.name={name} --sort-by=.lastTimestamp")
                return ("ContainerCreating: image is still pulling or the CNI is slow",
                        f"kubectl get events --field-selector involvedObject.name={name} --sort-by=.lastTimestamp")
        return ("Pending with a node assigned but no container status yet",
                f"kubectl describe pod {name}")

    # Branch 2: Running, but is each container alive and ready?
    for s in statuses:
        waiting = s.get("state", {}).get("waiting", {})
        last = s.get("lastState", {}).get("terminated", {})
        if waiting.get("reason") == "CrashLoopBackOff" or s.get("restartCount", 0) >= 3:
            code = last.get("exitCode")
            if last.get("reason") == "OOMKilled":
                return (f"OOMKilled after {s['restartCount']} restarts: memory limit is below real usage or there is a leak",
                        f"kubectl top pod {name} --containers; check resources.limits.memory")
            if code == 137 and "Unhealthy" in reasons:
                return ("Killed by a failing liveness probe: the probe is wrong or the app starts slowly",
                        f"kubectl describe pod {name} | grep -A2 Liveness; add a startupProbe")
            if code in (126, 127):
                return (f"Exit code {code}: the command or entrypoint does not exist in the image",
                        f"kubectl debug {name} -it --copy-to=dbg --container={s['name']} -- sh")
            if code == 0:
                return ("Exit code 0 in a loop: the main process finishes on purpose; wrong command for a server",
                        f"kubectl get pod {name} -o jsonpath='{{.spec.containers[0].command}}'")
            return (f"CrashLoopBackOff with exit code {code}: the application itself is failing on start",
                    f"kubectl logs {name} -c {s['name']} --previous")

    ready = conditions.get("Ready", {}).get("status")
    if phase == "Running" and ready != "True":
        if "Unhealthy" in reasons:
            return ("Running but not Ready: the readiness probe fails, so the pod is out of the Service",
                    f"kubectl describe pod {name} | grep -A3 Readiness; kubectl exec {name} -- wget -qO- localhost:8080/healthz")
        return ("Running but not Ready: no probe failure logged, check that a readiness probe exists",
                f"kubectl get pod {name} -o jsonpath='{{.spec.containers[0].readinessProbe}}'")

    if phase == "Running" and ready == "True":
        return ("Healthy: Running and Ready. If users still see errors, the fault is upstream (Service, ingress) or downstream (DB)",
                "kubectl get endpointslices -l kubernetes.io/service-name=<svc>; then walk the request path")

    if phase in ("Failed", "Succeeded"):
        return (f"Phase {phase}: a finished Job or an evicted pod; read the reason",
                f"kubectl get pod {name} -o jsonpath='{{.status.reason}} {{.status.message}}'")
    return ("Unknown state", f"kubectl describe pod {name}")


SAMPLES = [
    {"name": "api-1", "namespace": "shop", "phase": "Pending", "containerStatuses": [],
     "conditions": [{"type": "PodScheduled", "status": "False",
                     "message": "0/6 nodes are available: 6 Insufficient cpu."}], "events": []},
    {"name": "api-2", "namespace": "shop", "phase": "Pending",
     "containerStatuses": [{"name": "api", "restartCount": 0,
                            "state": {"waiting": {"reason": "ImagePullBackOff"}}}],
     "conditions": [{"type": "PodScheduled", "status": "True"}],
     "events": [{"reason": "Failed", "message": "manifest for api:1.5.0 not found"}]},
    {"name": "api-3", "namespace": "shop", "phase": "Running",
     "containerStatuses": [{"name": "api", "restartCount": 7,
                            "state": {"waiting": {"reason": "CrashLoopBackOff"}},
                            "lastState": {"terminated": {"exitCode": 1, "reason": "Error"}}}],
     "conditions": [{"type": "Ready", "status": "False"}],
     "events": [{"reason": "BackOff", "message": "Back-off restarting failed container"}]},
    {"name": "worker-4", "namespace": "shop", "phase": "Running",
     "containerStatuses": [{"name": "worker", "restartCount": 4,
                            "state": {"waiting": {"reason": "CrashLoopBackOff"}},
                            "lastState": {"terminated": {"exitCode": 137, "reason": "OOMKilled"}}}],
     "conditions": [{"type": "Ready", "status": "False"}], "events": []},
    {"name": "api-5", "namespace": "shop", "phase": "Running",
     "containerStatuses": [{"name": "api", "restartCount": 0, "state": {"running": {}}}],
     "conditions": [{"type": "Ready", "status": "False"}],
     "events": [{"reason": "Unhealthy", "message": "Readiness probe failed: HTTP 503"}]},
    {"name": "api-6", "namespace": "shop", "phase": "Running",
     "containerStatuses": [{"name": "api", "restartCount": 0, "state": {"running": {}}}],
     "conditions": [{"type": "Ready", "status": "True"}], "events": []},
]

EXPECTED = ["no node has room", "Image pull failed", "exit code 1", "OOMKilled",
            "readiness probe fails", "Healthy"]

if __name__ == "__main__":
    for pod, expect in zip(SAMPLES, EXPECTED):
        diag, cmd = diagnose(pod)
        print(f"{pod['name']:<9} {pod['phase']:<8} -> {diag}")
        print(f"{'':<21}next: {cmd}")
        assert expect in diag, (pod["name"], diag)
    print(f"\n{len(SAMPLES)} sample pods diagnosed, all matched the expected branch")
Key takeaways
Scope first: who, how many, since when. "Since when" points at what changed.
Protect users before you understand the cause: rollback, failover, scale, flag. A rollback that does not help is evidence too.
Walk the request path in order and stop at the first hop that breaks its promise; everything after it is a symptom.
One hypothesis, one command, one change at a time, with a timer. Negative results are worth writing down.
Refused means nothing listens, timeout means something drops packets, reset means someone closed an open connection.
The Kubernetes loop is describe, logs, previous, events, exec; use
kubectl debugwith--targetwhen the image has no shell.For latency, find the longest span with no long children; without traces, the first hop whose p99 rose while its downstream did not.
The incident note has impact in numbers, a timeline, one-sentence cause, trigger, fix and owned follow-ups.
Common mistakes
Restarting things before scoping. The restart destroys the evidence and the problem comes back.
Debugging the code for twenty minutes while a rollback was available in twenty seconds.
Changing three things at once and declaring whichever one came last as the fix.
Reading
kubectl get podsand neverkubectl describeEvents, or never--previouson a crashing container.Treating a timeout and a refused connection as the same problem; they point at different layers.
Raising a timeout or a limit to make a symptom disappear without finding what got slower or bigger.
Practice
On kind, deploy a web app, then break it five ways one at a time: wrong image tag, Service targetPort off by one, readiness path 404, memory limit of 20Mi, and a Role without the
list podsverb. For each, write the symptom, the single command that confirmed it, and the fix, before you look at the answer.Use a distroless image (any
gcr.io/distrolesssample) and prove thatkubectl execfails, then attach an ephemeral container with--targetand show the app's listening port with netstat.On a Linux VM, fill the disk with a file, delete it while a process holds it open (
sleep 1000 < bigfile &), confirm thatdfanddudisagree, find it withlsof +L1, and free the space without killing the process.Write an incident note for one of the breaks above in the order given in this lesson, under ten lines, with the impact in numbers from
kubectl get --raw /metricsor your load generator.
Interview questions (10)
1.Users report the site is slow. What do you check first?Medium
I scope before I touch anything: is it every user or some, every endpoint or one, every region or one, and since when. The RED panel per service shows me rate, errors and p99 split by version and region, and "since when" lines up with a deploy, a traffic change or a dependency incident. Then I protect: if it started with a deploy I roll back right away; if traffic doubled I scale. Only then do I follow the path with traces to the longest span with no long children, and on that hop I run USE on the host or pool to see what it ran out of. Along the way I write timestamps and commands, because this becomes the incident note.
2.A pod is Running but the Service returns 502. Walk me through it.Medium
Running only means a process started. First I check the pod is Ready and in the EndpointSlice: kubectl get endpointslices -l kubernetes.io/service-name=api. If there are no addresses, the selector does not match the pod labels or the readiness probe is failing, and describe pod shows which. If the addresses are there, 502 means the proxy connected to the pod and got refused or garbage, so I check the port chain: Ingress backend port, Service port and targetPort, and what the container actually listens on with kubectl debug --target and netstat -tlnp. The usual causes are a targetPort that differs from the listening port, or TLS expected on one side only. A 504 instead would send me to a slow backend and the proxy timeout.
3.What is the difference between connection refused, timeout and reset, and what does each tell you?Easy
Refused means the packet reached the host and the kernel answered with a reset because nothing listens on that port: the service is down, on another port, or bound to loopback only; the network path is fine. Timeout means nobody answered at all, so something drops packets: a security group, NACL, NetworkPolicy, firewall or a wrong route or IP. Reset means a connection existed and one side closed it: an idle timeout on a load balancer, a crashed process, or a keepalive mismatch. Each word points at a different layer, so I never treat them as one problem.
4.A deploy passed every CI check and fails in production. Where do you look?Medium
Something differs between the environments, so I diff them. First the image: is production running the same digest that CI tested, or was it rebuilt. Then configuration: ConfigMaps, Secrets and ExternalSecrets in both namespaces, and environment variables in the rendered manifests. Then resources: a lower memory limit in prod produces OOMKilled that staging never saw. Then data: a migration applied in staging but not prod, or a dataset size that makes a query slow. The prevention is to promote one immutable artifact through environments and to render and diff environment manifests in CI so the difference is visible before the deploy.
5.Every kubectl apply in the cluster fails with "context deadline exceeded calling webhook". What happened and what do you do?Hard
An admission webhook is unreachable and is configured with failurePolicy: Fail, so the API server refuses every matching request until the webhook answers. The webhook is usually a policy engine or a sidecar injector whose pods are down, and if the webhook also matches kube-system it can block the very pods it needs to come back. I list the webhook configurations, find the one named in the error, and check its pods. If they cannot recover on their own I set that one webhook to failurePolicy: Ignore as a break-glass step, record it, bring the pods back, and restore Fail. The prevention is a namespaceSelector that excludes kube-system, replicas and a PodDisruptionBudget for the webhook, and alerting on its latency.
6.Disk is at 100 percent on a node but du cannot find the files. Why, and how do you fix it?Easy
A process is holding a deleted file open. The directory entry is gone, so du cannot see it, but the blocks stay allocated until the last file descriptor closes. lsof +L1 lists open files with a link count of zero and the process holding them; it is almost always a log file that was deleted instead of rotated. I truncate it through the file descriptor path, for example : > /proc/PID/fd/N, or restart the process, which releases the space immediately. The prevention is logrotate with copytruncate, or sending logs to stdout so the container runtime manages them.
7.How do you debug a pod whose image has no shell?Medium
I attach an ephemeral container with kubectl debug -it POD --image=busybox:1.36 --target=app. It shares the pod's network namespace, so I can test the app on localhost, and --target shares the process namespace so I can see the app's processes and sockets with ps and netstat. For a pod that crashes before I can attach, I use --copy-to with a different command so the copy starts with the same env and mounts but runs a shell. For node problems, kubectl debug node/NAME runs a pod with the host filesystem at /host. In a namespace with the restricted Pod Security profile, --profile=restricted makes the debug container pass admission.
8.What is in a good incident note and when do you write it?Easy
I write it during the incident, as a running log of timestamps, commands and decisions, and tidy it within an hour of resolution while I still remember. It contains impact in numbers (who, how many requests or users, from when to when), what users saw, the timeline of detection, mitigation and resolution, the root cause in one sentence, the trigger that exposed it, what fixed it, and follow-ups with owners. It names services and commands, not people, because the cause is a condition in the system. The note is the input to the postmortem and the first thing the next on-call reads when the same alert fires.
9.DNS inside the cluster fails about one request in a hundred. What do you check?Hard
Intermittent DNS has three usual causes. First, ndots:5: a name like api.example.com has two dots, so the resolver tries four cluster suffixes first, which multiplies CoreDNS load by five and makes a single dropped UDP packet into a visible failure; I check /etc/resolv.conf in the pod and fix with a trailing dot or dnsConfig with ndots:2. Second, CoreDNS itself: its CPU usage against its limit, its logs for SERVFAIL, and whether it has enough replicas and the autoscaler. Third, the conntrack race on UDP, where two parallel A and AAAA queries collide; NodeLocal DNSCache avoids it. I measure with the CoreDNS request duration and error metrics before and after each change.
10.HPA shows unknown for the CPU target and never scales. Why?Easy
<unknown> means the HPA cannot compute utilization. Either metrics-server is not installed or not healthy, so there are no pod metrics, or the pods have no CPU requests, because utilization is measured as a percentage of the request and a percentage of nothing is undefined. kubectl describe hpa names the condition. I install or fix metrics-server, set CPU requests from measurement, and then check the other reasons a healthy HPA still does not move: maxReplicas already reached, or the scale-down stabilization window, which is five minutes by default.
Quiz
1.An on-call engineer sees 5xx errors starting right after a deploy. What is the correct first action?
2.`nc -zv db.internal 5432` returns "Connection refused" immediately. What does that tell you?
3.`kubectl get endpointslices -l kubernetes.io/service-name=api` shows no addresses. Which is NOT a likely cause?
4.Which exit code in lastState.terminated means the container was killed by SIGKILL, for example by the OOM killer?
5.A pod's image has no shell. Which command gives you a shell with a view of the app's processes?
Practice these problems
- OPSPod stuck in CrashLoopBackOffEasy
- OPSPods Pending and ImagePullBackOff after a node group changeEasy
- OPS502 from the ingress while the service works inside the clusterMedium
- OPSHigh load average and a process eating memory on a Linux hostMedium
- OPSIntermittent DNS resolution failures in the clusterHard
- OPSDatabase connections exhausted after a deployMedium
Further reading
My notes
Your notes
Autosaves to this browser.