Interview playbook, what is new in 2026, revision sheet
This is the last stop before an interview. It lists the rounds a DevOps, SRE or platform candidate faces in 2026 and what each one tests, gives a fixed structure for troubleshooting and design answers, a table of what changed recently and a line to say about each, a 42-term revision sheet, the 15 questions Indian service and product companies ask most, how to talk about projects, and a one-week plan.
Why it matters
Most candidates fail interviews they could have passed, not because they lacked knowledge but because they answered a troubleshooting scenario by guessing, a design question without numbers, and "tell me about an outage" without a structure. The content of the earlier lessons is necessary; this lesson is about delivery. Interviewers at Infosys, Capgemini and TCS report asking the same ten things again and again, and product companies add design and incident rounds. Knowing the format lets you spend your nervous energy on the answer instead of on the surprise.
Read first: Kubernetes in production - resources, autoscaling, RBAC, upgrades, EKS, GitOps with Argo CD and progressive delivery, Observability - Prometheus, Grafana, OpenTelemetry, logs and alerting, SRE practice - SLOs, error budgets, incidents and postmortems, Troubleshooting playbook - Linux, Docker, Kubernetes, network, pipelines, Security and DevSecOps - secrets, least privilege, supply chain, policy as code
Lesson
The rounds and what each one tests
Service companies (Infosys, Wipro, Capgemini, TCS) usually run screening, one technical round mixing Linux, Docker, Kubernetes, Terraform and a CI tool, then a manager round. Product companies add the design and incident rounds and go deeper on Kubernetes. Jenkins still appears in service-company questions; GitHub Actions and GitLab CI are what newer teams use, and the answer structure is the same for all three.
How to answer a troubleshooting scenario
Six steps; say each name out loud so the interviewer can follow.
- Scope. One pod, one service or the cluster? Since when? What changed: a deploy, a config, a node?
- Protect. Mitigate before diagnosing: roll back, scale up, fail over, disable the flag. Say that order explicitly.
- Follow the path. Client to pod: DNS, load balancer, Ingress or Gateway, Service, EndpointSlice, pod, container, dependency. Name the command for each hop.
- Evidence.
kubectl describeevents,kubectl logs --previous, the exit code, the PromQL, the target health. - Fix through the proper path. Git and the pipeline, not a hand edit; the exception is a live
kubectl rollout undoduring an outage, and Git is made to match afterwards. - Prevent. The alert, test, probe, policy or budget that would have caught it earlier.
How to answer a design question
- Clarify in two or three questions: users, scale, what exists, what "done" means.
- Requirements: three functional, three non-functional with numbers (latency, availability, RPO and RTO, cost).
- Numbers: requests per second, pods, nodes, GB per day, monthly cost. Say the arithmetic.
- Design: boxes in the order traffic flows, then the control plane around them (CI, GitOps, observability, secrets).
- Trade-offs: for each big choice, the one you did not pick and why (EKS vs ECS, Karpenter vs node groups, canary vs blue-green).
- Failure modes: a zone down, a bad deploy, a slow dependency, a leaked secret.
- Operations: who is on call, which SLOs page, how upgrades and cost reviews happen.
No numbers and no failure modes is the most common reason a strong candidate is marked "junior".
What is new in 2026 and a line you can say
Dated claims were checked on the official pages during writing; everything else is undated.
The revision sheet: 42 terms, one line each
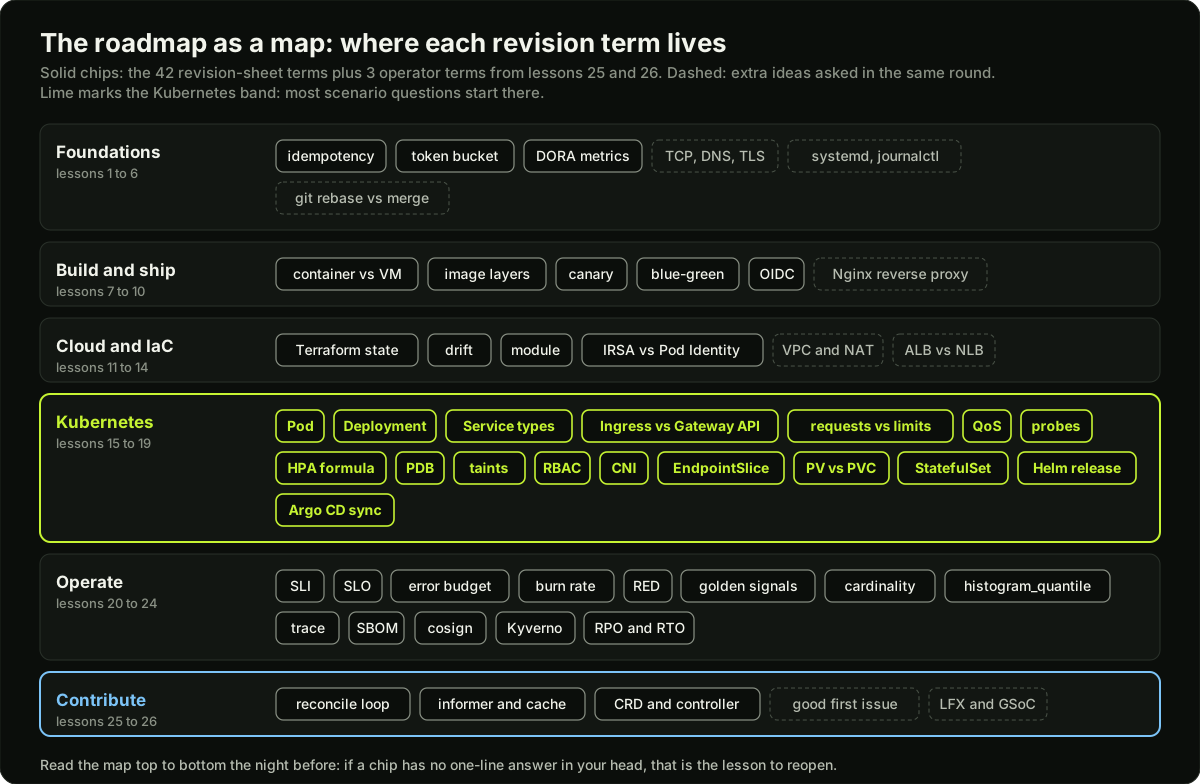 The six roadmap modules as horizontal bands, each holding the revision terms that belong to it, with the Kubernetes band highlighted
The 15 questions Indian DevOps interviews ask most
Confirmed from candidate reports on the Glassdoor pages for Infosys, Capgemini and TCS in the resources, and the bregman-arie exercises.
- Docker vs Kubernetes. Docker builds and runs one container on one host. Kubernetes schedules many containers across hosts, restarts, scales and addresses them. Docker makes the image; Kubernetes runs the fleet through containerd.
- Explain your CI/CD pipeline end to end. Push triggers lint and tests, an image build tagged with the commit SHA, a scan, a signature, a push to the registry. CD updates the tag in the GitOps repo; Argo CD syncs staging, smoke tests run, a canary reaches production. Rollback is a revert.
- A pod is in CrashLoopBackOff; debug it.
kubectl describe podfor the exit code and events,kubectl logs --previousfor the crash output. Usual causes: a missing env or secret, a wrong command, a failing migration, OOMKilled, a liveness probe too strict. Fix in Git, redeploy, confirm restarts stop. - Requests vs limits. Requests are what the scheduler reserves and the HPA measures against; limits are enforced at run time. Memory over the limit is OOM-killed; CPU over it is throttled. Memory requests equal limits; CPU requests from measurement.
- Where is the Terraform state file? In S3 with versioning and encryption, locking on with
use_lockfile(the DynamoDB method is deprecated). One state per environment, never in Git. Locking stops two applies at once. - What is an init container? It runs to completion before the app containers start: wait for a database, run a migration, fetch config. If it fails the pod restarts it, so the app never starts half-configured.
- Kubernetes deployment strategies. RollingUpdate (default, bounded by maxSurge and maxUnavailable) and Recreate; above the Deployment, blue-green and canary with Argo Rollouts or weighted HTTPRoutes. Pick canary when you can measure errors per version.
- What happens when a developer pushes to GitHub? The webhook starts the workflow; a runner checks out the commit, tests and builds; on success it pushes the image and updates the manifest. Branch protection blocks the merge until checks pass.
- CMD vs ENTRYPOINT. ENTRYPOINT is the executable that always runs; CMD gives default arguments that
docker runcan override. Use exec form so signals reach the process:ENTRYPOINT ["python","app.py"],CMD ["--port","8080"]. - How does a Service find its pods? By label selector; the EndpointSlice controller lists ready pod IPs; kube-proxy or Cilium forwards the virtual IP to them. No endpoints means a selector typo or failed readiness.
- PV vs PVC. The PV is the storage; the PVC is the pod's request for size and access mode. A StorageClass creates PVs dynamically (EBS CSI on EKS). The reclaim policy decides whether the disk survives.
- Autoscaling and path routing in production. HPA on CPU or a custom metric for pods, Karpenter for nodes, and an Ingress or HTTPRoute sending
/apiand/webto different Services. PDBs so scale-down never drops below the minimum. - AWS load balancer types. ALB for HTTP with host and path routing and WAF; NLB for TCP and UDP with static IPs; Gateway Load Balancer for inline appliances. On EKS the AWS Load Balancer Controller creates them.
- Linux troubleshooting.
topandfree -m,df -h,ss -tlnpfor ports,journalctl -u namefor a service,dmesgfor the kernel. Then the process itself. Fix, then write the alert. - A shell script that saved time. Problem, what it did, the number: "a log analyser counting 5xx per endpoint per minute cut triage from 20 minutes to 1". Add
set -euo pipefail, a temp dir and a dry-run flag.
Talking about projects and open source
Five beats for any project: the problem in one sentence, the design as a 30-second diagram, the numbers (requests, nodes, cost, time saved), what broke and how you found it, what you would change now. For open source, add the review: what the maintainer asked for and why. "I fixed a nil check" is weak; "the reconciler panicked when the status subresource was missing, I added the check and a test, and the maintainer asked me to return an error so the item is requeued" shows you understood the control loop.
# Rehearse with a timer: 90 seconds per project, said out loud.
for p in "ci-pipeline" "eks-platform" "uptime-monitor" "operator"; do
  echo "== $p: problem, design, numbers, what broke, what you would change"
  sleep 90
done
A one-week revision plan
Diagram
Worked example
"A deploy went out and error rate jumped from 0.1 to 4 percent. What do you do?" A 3-minute answer, as you would say it.
"First I scope it. I check whether the jump lines up with the deploy time and whether it is this service only: kubectl rollout history deployment/checkout -n payments shows revision 14 went out at 14:02, and the error rate in Grafana rises at 14:03. One service, one change: the deploy is the prime suspect.
Second, I protect users before I diagnose. Four percent errors on checkout is money, so I roll back now: kubectl rollout undo deployment/checkout -n payments, then kubectl rollout status deployment/checkout -n payments to watch it finish. If Argo CD manages this app I also revert the commit in the GitOps repo, otherwise Argo CD will sync the bad version straight back. I confirm with the PromQL I already have on the dashboard: sum(rate(http_requests_total{service="checkout",code=~"5.."}[2m])) / sum(rate(http_requests_total{service="checkout"}[2m])) should fall back under 0.1 percent within two minutes.
Third, with users safe, I look for the cause. kubectl get pods -n payments -l app=checkout tells me if the new pods were crashing or healthy. If they were Running with no restarts, the errors came from inside the app: kubectl logs deployment/checkout -n payments --since=10m | grep -c ' 500 ' and the first stack trace. Typical causes: a new config key the pods could not read, a database migration that ran ahead of the code, a timeout to a dependency that the new version calls more often. If pods were restarting, kubectl describe pod for the exit code and kubectl logs --previous.
Fourth, I fix it through the pipeline: the fix is a commit, it goes through CI, and it ships as revision 16. No hand edits in the cluster.
Fifth, I prevent it. This should have been caught before 4 percent: a canary with an analysis template that compares 5xx rate of the new version with the stable one over five minutes and aborts automatically, a readiness probe that fails if the config is missing, and an alert on 5xx ratio with a 2-minute window so a human sees it in one minute, not ten.
I would close with: the deploy caused it, we rolled back within three minutes, the fix was X, and from now on a canary gate stops this at 1 percent of traffic."
Runnable code
"""Flashcard drill over the revision sheet.

Usage: python3 drill.py [module] [count]
  module: one of foundations, build, cloud, kubernetes, operate, or all (default all)
  count:  how many cards to show (default: all in the module)

The deck is embedded. Shuffling uses a fixed seed so a run is repeatable, which
matters when you want to drill the same ten cards again tomorrow.
"""
import random
import sys

DECK = {
    "foundations": [
        ("token bucket", "Tokens refill at a fixed rate up to a capacity; a request spends one or is rejected; capacity is the burst."),
        ("idempotency", "Doing it twice gives the same result as once; needed for retries, kubectl apply and Terraform."),
        ("DORA metrics", "Deployment frequency, change lead time, change fail rate, failed deployment recovery time (was MTTR)."),
    ],
    "build": [
        ("container vs VM", "Process isolated with namespaces and cgroups on the host kernel; a VM has its own kernel on a hypervisor."),
        ("image layers", "Each Dockerfile instruction is a cached read-only layer; the container adds one writable layer."),
        ("canary", "A small share of traffic goes to the new version; promote on metrics or abort."),
        ("blue-green", "Two full environments; switch all traffic at once, switch back for instant rollback."),
        ("OIDC", "CI gets a short-lived token and exchanges it with AWS STS for a role; no long-lived keys."),
    ],
    "cloud": [
        ("Terraform state", "Maps config to real resource IDs; remote in S3 with locking enabled with use_lockfile."),
        ("drift", "Real infrastructure differs from state or config; terraform plan shows it."),
        ("module", "Reusable Terraform unit with variables and outputs; pin versions by tag."),
        ("IRSA vs Pod Identity", "IRSA: ServiceAccount to IAM role through the cluster OIDC provider. Pod Identity: agent add-on plus association, no per-cluster OIDC trust."),
    ],
    "kubernetes": [
        ("Pod", "Smallest scheduled unit: containers sharing IP, ports and volumes; disposable."),
        ("Deployment", "Owns ReplicaSets, rolls out within maxSurge and maxUnavailable; rollout undo is the fastest rollback."),
        ("Service types", "ClusterIP inside, NodePort on every node, LoadBalancer via the cloud, ExternalName as a DNS alias."),
        ("Ingress vs Gateway API", "Ingress: host and path with controller annotations. Gateway API: Gateway for platform, HTTPRoute for apps, typed fields."),
        ("requests vs limits", "Requests are reserved by the scheduler; limits are enforced: OOM kill for memory, throttling for CPU."),
        ("QoS", "Guaranteed when requests equal limits everywhere, Burstable when some set, BestEffort when none."),
        ("probes", "Readiness gates traffic, liveness restarts, startup protects slow starters."),
        ("HPA formula", "desired = ceil(current x currentMetric / targetMetric), evaluated every 15 seconds by default."),
        ("PDB", "minAvailable or maxUnavailable that voluntary disruptions such as drain must respect."),
        ("taints", "Node repels pods unless tolerated: NoSchedule, PreferNoSchedule, NoExecute."),
        ("RBAC", "Role lists verbs on resources; a RoleBinding gives it to a user, group or ServiceAccount."),
        ("CNI", "Plugin that gives pods IPs and connectivity: VPC CNI on EKS, Cilium with eBPF."),
        ("EndpointSlice", "Ready pod IPs behind a Service, split into slices; replaced Endpoints."),
        ("PV vs PVC", "PV is the disk; PVC is the request; a StorageClass creates PVs on demand."),
        ("StatefulSet", "Stable names, ordered start, own PVC per pod; for databases and Kafka."),
        ("Helm release", "One installed chart instance in a namespace with revisions; helm rollback."),
        ("Argo CD sync", "Compare live with Git; OutOfSync means different; sync applies, prune deletes, selfHeal reverts."),
    ],
    "operate": [
        ("SLI", "A measured indicator: fraction of good requests, latency under a threshold."),
        ("SLO", "A target for an SLI over a window: 99.9 percent over 30 days."),
        ("error budget", "1 minus the SLO; 0.1 percent of 30 days is about 43 minutes."),
        ("burn rate", "How fast the budget is spent; 14.4 over 1 hour uses 2 percent of a 30-day budget."),
        ("RED", "Rate, Errors, Duration for every request-driven service."),
        ("golden signals", "Latency, traffic, errors, saturation."),
        ("cardinality", "Number of distinct label combinations; user IDs as labels blow it up."),
        ("histogram_quantile", "histogram_quantile(0.99, sum by (le) (rate(bucket[5m]))) gives p99."),
        ("trace", "One request across services as spans sharing a trace ID; traceparent carries it."),
        ("SBOM", "List of every package in an image, SPDX or CycloneDX, generated at build and scanned."),
        ("cosign", "Signs and verifies images, keyless via Sigstore; verified at admission."),
        ("Kyverno", "YAML policy engine that validates, mutates or generates at admission."),
        ("RPO and RTO", "RPO: how much data you may lose. RTO: how long you may be down."),
    ],
}


def cards(module):
    if module == "all":
        return [(m, t, a) for m in DECK for t, a in DECK[m]]
    if module not in DECK:
        raise SystemExit(f"unknown module {module!r}; choose from {', '.join(DECK)} or all")
    return [(module, t, a) for t, a in DECK[module]]


def drill(module="all", count=None, seed=2026):
    deck = cards(module)
    rng = random.Random(seed)          # fixed seed: same order every run
    rng.shuffle(deck)
    shown = deck[:count] if count else deck
    for i, (m, term, answer) in enumerate(shown, 1):
        print(f"{i:2d}. [{m}] {term}")
        print(f"    {answer}")
    return len(shown), len(deck)


if __name__ == "__main__":
    module = sys.argv[1] if len(sys.argv) > 1 else "all"
    count = int(sys.argv[2]) if len(sys.argv) > 2 else None
    shown, total = drill(module, count)

    # Self-checks on the deck itself.
    all_terms = [t for m in DECK for t, _ in DECK[m]]
    assert len(all_terms) == 42, f"deck has {len(all_terms)} terms, expected 42"
    assert len(set(all_terms)) == len(all_terms), "duplicate term in the deck"
    assert all(len(a) <= 160 for m in DECK for _, a in DECK[m]), "an answer is longer than one line"
    first = [t for _, t, _ in cards("kubernetes")]
    random.Random(7).shuffle(first)
    again = [t for _, t, _ in cards("kubernetes")]
    random.Random(7).shuffle(again)
    assert first == again, "same seed must give the same order"

    per_module = {m: len(DECK[m]) for m in DECK}
    print(f"\nshown {shown} of {total} cards in module '{module}'")
    print("cards per module:", ", ".join(f"{m}={n}" for m, n in per_module.items()))
    print("checks passed: 42 unique terms, one-line answers, repeatable shuffle")
Key takeaways
Know the round before you enter it: screening, Linux and scripting, Kubernetes scenarios, CI/CD and IaC, design, incident. Each has a different pass condition.
Troubleshooting answers follow scope, protect, follow the path, evidence, fix through the proper path, prevent. Say the step names.
Design answers need numbers, trade-offs and failure modes, or you will be graded as junior.
The 2026 defaults to say by name: GitOps, OpenTelemetry, Gateway API, Karpenter, Cilium, SBOM and cosign, policy at admission, FinOps, human-approved AI assistance, GPU tenants, GitHub Actions and GitLab CI.
Indian service-company rounds repeat the same 15 questions; prepare three-line answers and the one command that proves each.
Tell a project as problem, design, numbers, what broke, what you would change.
Mitigate before you diagnose, and fix through Git afterwards; interviewers listen for that order.
Rehearse out loud with a timer; reading is not practice.
Common mistakes
Starting a troubleshooting answer with a guess ("it is probably DNS") instead of scoping and protecting first.
Giving a design with no numbers, no cost and no failure modes.
Saying "Kubernetes runs Docker", "Secrets are encrypted" or "liveness probe removes the pod from the Service".
Describing a project without a number: no requests per second, no time saved, no cost.
Claiming tools you cannot demonstrate; interviewers follow up on every tool in your resume.
Fixing the scenario with a hand edit in the cluster and never mentioning Git or the pipeline.
Practice
Run the flashcard drill for the kubernetes module with count 10, say each answer before reading it, and record how many you got right; repeat daily until 10 of 10.
Record yourself answering the deploy scenario in the worked example in under 3 minutes, then listen for the six step names; redo it until all six are said out loud.
In a kind cluster, break a Deployment three ways (wrong image tag, missing ConfigMap key, liveness probe on the wrong port) and time yourself from symptom to root cause using only describe, logs and events; target under 5 minutes each.
Write your three projects in the five-beat format (problem, design, numbers, what broke, what you would change) in under 120 words each and have a friend ask one follow-up per beat.
Interview questions (10)
1.Tell me about an outage you handled.Medium
I give a timeline. "At 14:02 a deploy of the checkout service went out; at 14:05 the 5xx alert fired at 4 percent. I was on call. I checked rollout history, saw the deploy matched the time, and rolled back at 14:08; error rate was back under 0.1 percent by 14:10. The cause was a config key renamed in the new version with no default, so half the requests failed on a nil value. The fix went through a PR with a test for the missing key, and we added a canary step with automatic analysis on 5xx ratio, so the same bug now stops at 5 percent of traffic. The postmortem was blameless and the action items are closed." Timeline, my action, root cause, prevention.
2.Pods are Pending after you scaled a Deployment. What do you check first?Easy
kubectl describe pod and read the Events: the scheduler writes why it could not place the pod. The usual messages are insufficient cpu or memory, no nodes matched a nodeSelector or affinity, an untolerated taint, or a PVC that cannot bind in that zone. If it is capacity, I check whether Karpenter or the Cluster Autoscaler is adding a node and whether the NodePool limits or the account quota block it. If it is a selector or taint, I fix the manifest in Git. I never fix Pending by deleting pods; the scheduler will produce the same result.
3.How would you design a CI/CD pipeline for 30 microservices in one repo?Hard
I clarify languages, deploy target and how often teams ship. Then: a monorepo pipeline that detects changed paths so only affected services build; each build runs lint and unit tests, builds a multi-stage image tagged with the commit SHA, scans it, generates an SBOM and signs it with cosign, and pushes to ECR using OIDC rather than stored keys. CD is GitOps: the pipeline updates the image tag in a config repo, Argo CD syncs staging, smoke tests run, then a canary in production with automatic analysis. Numbers: 30 services, maybe 200 builds a day, so caching and self-hosted runners matter. Failure modes: a flaky test blocks everyone, so I quarantine flaky tests; a bad base image breaks every build, so I pin digests.
4.What is new in Kubernetes networking that you would use on a new cluster?Medium
Gateway API instead of Ingress for anything new: Gateway and GatewayClass owned by the platform team, HTTPRoute owned by each app team, with typed fields for header matching and traffic weights instead of controller-specific annotations. The Kubernetes project announced that Ingress NGINX best-effort maintenance ends in March 2026, so new work should not start on it. For the CNI I would consider Cilium, which can replace kube-proxy with eBPF and gives L7 network policy and per-flow observability through Hubble. On EKS I would keep VPC CNI if the team already knows it and add Cilium only when policy or observability demands it.
5.Why GitOps rather than kubectl apply from the pipeline?Easy
With GitOps the cluster pulls its desired state from Git through Argo CD or Flux, so the pipeline never needs cluster credentials, every change is a reviewed commit, rollback is a revert, and drift is visible: if someone edits live, the app shows OutOfSync and selfHeal can revert it. With kubectl apply from CI you have cluster-admin tokens in the CI system, no record of what is actually running beyond the last successful job, and no way to detect hand edits. The cost is one more repo and the discipline to change nothing by hand.
6.How do you talk about an open-source contribution in an interview?Easy
Problem, design, numbers, what broke, what I would change, plus the review. For example: "Karpenter logged a misleading message when a NodePool limit was hit; I traced it to the consolidation path, added the limit name to the log and a unit test, and the maintainer asked me to use structured fields instead of string formatting. The PR took three rounds over two weeks." That shows I can read a Go controller, write a test, and take review. I would avoid listing a one-line typo fix as a contribution unless I can explain the code around it.
7.A design question: an uptime monitor for 10,000 URLs checked every minute. Walk me through it.Hard
Clarify: check type (HTTP status and latency), regions, alert channels. Numbers: 10,000 checks a minute is 167 per second, trivially small; the hard part is false alerts, so each failure is confirmed from a second region before alerting. Design: a scheduler that pushes due checks to a queue (Redis Streams or SQS), stateless workers in three regions that run checks and write results to a time-series store, an alert evaluator that applies "down if 2 regions fail twice in a row", and a web app. Failure modes: a worker region loses the internet and reports everything down, so quorum; a slow target holds a worker, so timeouts; the queue backs up, so a lag metric and autoscaling on it. Operations: SLO on check delay, cost per million checks.
8.What does a strong answer to "requests vs limits" sound like?Easy
Requests are what the scheduler reserves when placing the pod and what the HPA uses for its percentage; limits are enforced at run time by the kernel, OOM-kill for memory and CFS throttling for CPU. Requests also decide the QoS class, which decides eviction order under node pressure. My defaults: memory requests equal limits so the pod is never killed for someone else's spike, CPU requests from the measured p95, and I am careful with CPU limits because throttling shows up as latency that is hard to see. Then the follow-up they want: no requests at all means BestEffort and first to be evicted.
9.What do you do in the first minute of an incident?Medium
Acknowledge the page so nobody else gets woken, open the dashboard for the service, and answer three questions: what is the user impact, when did it start, and what changed. If a deploy or config change lines up with the start, I roll it back before any deeper diagnosis, because mitigation beats root cause while users are affected. I post a one-line status in the incident channel with the impact and what I am doing. Only then do I open logs and events. If the impact is large or spreading I ask for an incident commander so I can focus on the technical work.
10.What is new in 2026 that you have actually used?Medium
Be honest and specific. "I used Gateway API with HTTPRoutes on a kind cluster and on EKS with the AWS Load Balancer Controller; I ran Karpenter with a NodePool that consolidates and uses spot; I instrumented a Go service with the OpenTelemetry SDK and sent traces through the Collector to Tempo; and I signed images with cosign and blocked unsigned ones with a Kyverno policy." Then one thing you have only read about, said as such: "I have read the EKS Auto Mode docs but have not run it." Interviewers trust a candidate who draws the line between done and read.
Quiz
1.Error rate jumped right after a deploy. What is the first action in a strong answer?
2.Which of these is a reason interviewers give for marking a design answer as junior?
3.What does the HPA compute?
4.Which statement about Gateway API is correct?
5.A burn rate of 14.4 sustained for one hour consumes what share of a 30-day error budget?
6.Which answer to "where do you keep Terraform state" is current?
Practice these problems
- DESIGNMulti-environment Terraform: dev, staging and prod with remote stateMedium
- DESIGNProduction EKS cluster for a 30-engineer startupHard
- DESIGNSLO-based alerting and on-call systemMedium
- OPSPod stuck in CrashLoopBackOffEasy
- OPSDeploy rolled out, users see errors, readiness probes flappingMedium
- OPSTerraform plan wants to destroy the production databaseMedium
Further reading
- bregman-arie/devops-exercisesCodegithub.com
- Glassdoor: Infosys DevOps Engineer interview questionsArticleglassdoor.com
- Glassdoor: Capgemini DevOps Engineer interview questionsArticleglassdoor.co.in
- Glassdoor: Tata Consultancy Services DevOps Engineer interview questionsArticleglassdoor.com
- DORA: Research (State of DevOps)Paperdora.dev
My notes
Your notes
Autosaves to this browser.